
Google Search Console is one of the most powerful tools available for any website owner. Formerly known as Google Webmaster Tools, the search console is a free, one-stop platform where you can gain nearly every bit and byte of data you need to know about your site. With a firm grasp on how to manipulate and filter the massive amount of data you have access to through the Google Search Console, you can set up and execute any number of plans for your business with minimal guesswork.
What Can You Do With Google Search Console?
A lot. You can do a lot. GSC gives you access to lots of in-depth information. You can learn about organic visitors, referring domains, search traffic, time-on-site, crawl errors, devices your visitors use, and much, much more.
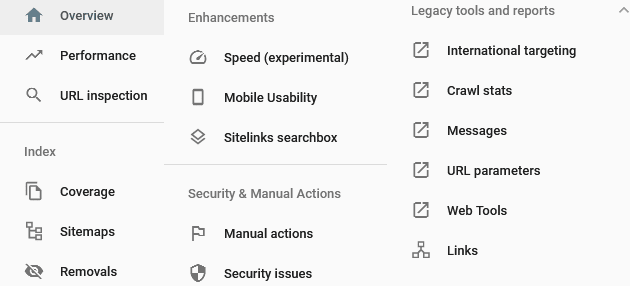
Even without digging into sub-menus and other reporting options, the basic Overview tab of the platform gives you a massive amount of options to wade through:
- Performance
- URL Inspection
- Coverage
- Sitemaps
- URL Removals
- Speed
- Mobile Usability
- Sitelink searchbox
- Manual Security Actions
- Security Issues
- International Targeting
- Crawl Stats
- Messages
- URL Parameters
- Web Tools
- Links
These are all available inside the default sidebar as soon as you log in. Realistically, not every single website admin is going to need every single option the GSC provides. The sheer number of options might seem overwhelming at first, too. But if you break it down into individual sections, it’s not so bad. We want to help you become comfortable navigating through what might be the most powerful tool on the internet.
Setting Up the Search Console
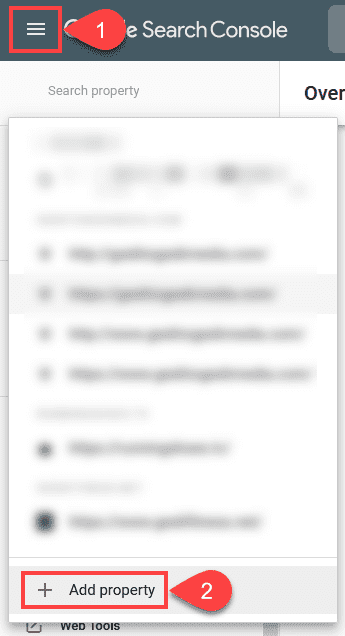
To get started with Google Search Console, you must verify the site you’re analyzing. There are plenty of services out there where you can get decent information about your competitors’ websites (SEMRush, for example), but GSC gives you such detailed information that you have to own the site. Verifying it is easy, however. Begin by clicking the hamburger menu in the left corner of the screen and selecting Add Property from the dropdown.
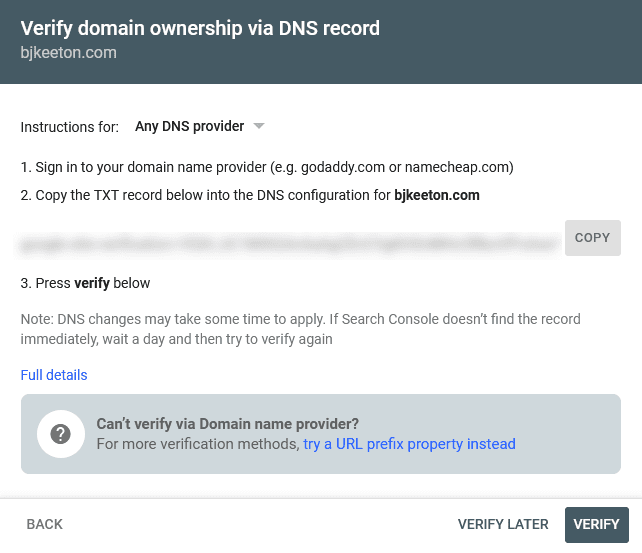
You will then be prompted to choose whether you’re verifying a Domain or URL Prefix. If you only need a single URL indexed such as https://example.com, URL Prefix will be fine. However, if you want insights on everything, Domain will be your choice. (This includes the top-level domain (such as subdomains, www, and http and https),
If you select Domain, you will verify by altering your site’s DNS record. You can do this through your hosting dashboard, and your host’s support can walk you through anything specific to them.
If you choose to verify by URL Prefix, the options are much more user-friendly an HTML meta tag in the site’s <head>, you can link it to an existing Google Analytics account, use the Google Tag Manager account, or use DNS verification like above.
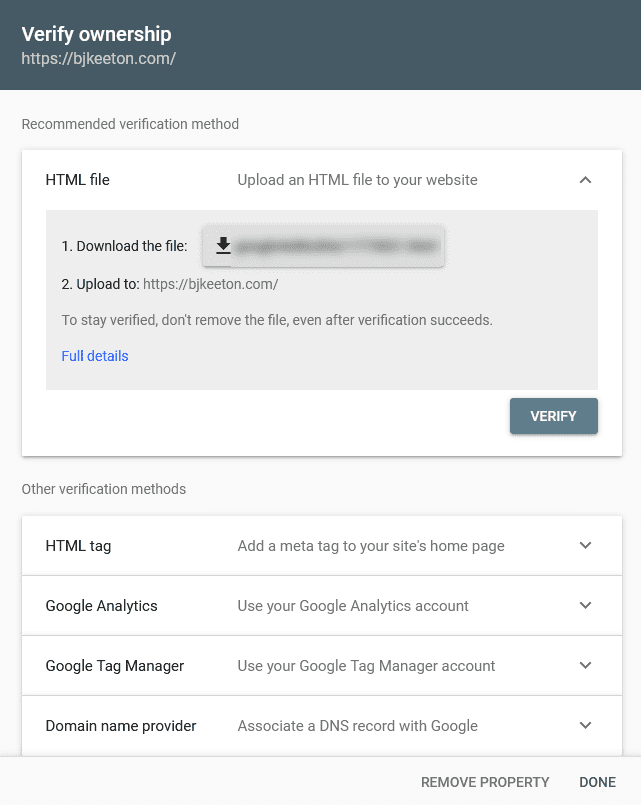
Regardless of how you verify, the important thing is that you do. Once done, you can access your overall Google Search Console dashboard. And this is where the magic happens.
Understanding the Basic Dashboard
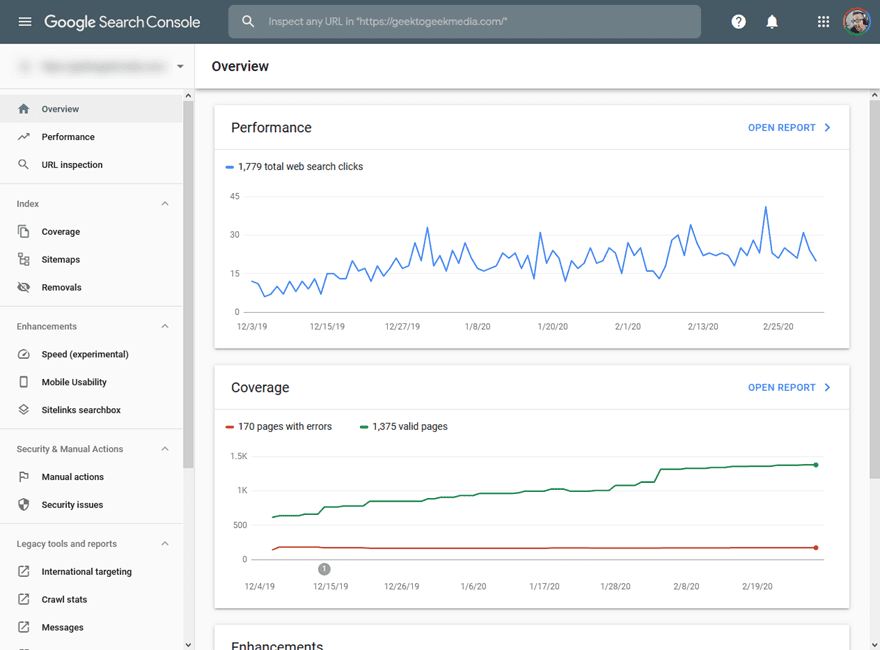
As we mentioned above, the left sidebar of the Search Console dashboard is rife with options and information. The default Overview tab gives you three cards that encapsulate the most common reasons folks use the service: Performance, Coverage, and Enhancements.
The Performance Report
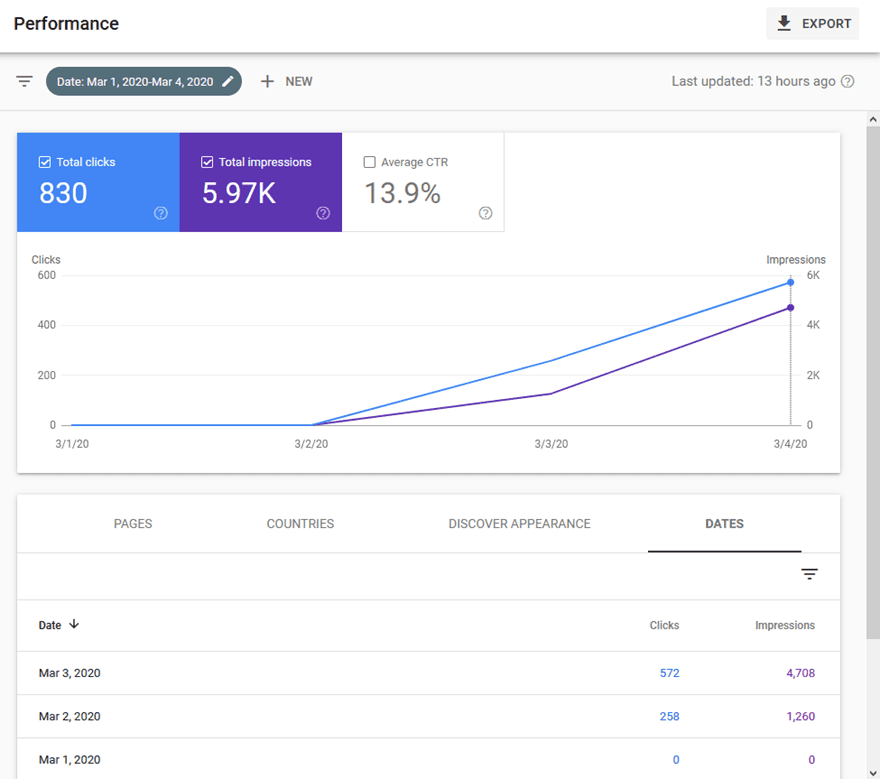
The Performance card gives you the overall performance of your website as it pertains to Google search results. The default overview is for 3 months, and you can see how many clicks your site received from organic search over that time period. If you click the Open Report link in the upper left corner of the card, you will see the full report for how your site performed in searches. The Performance link in the left-hand sidebar takes to this same page/report.
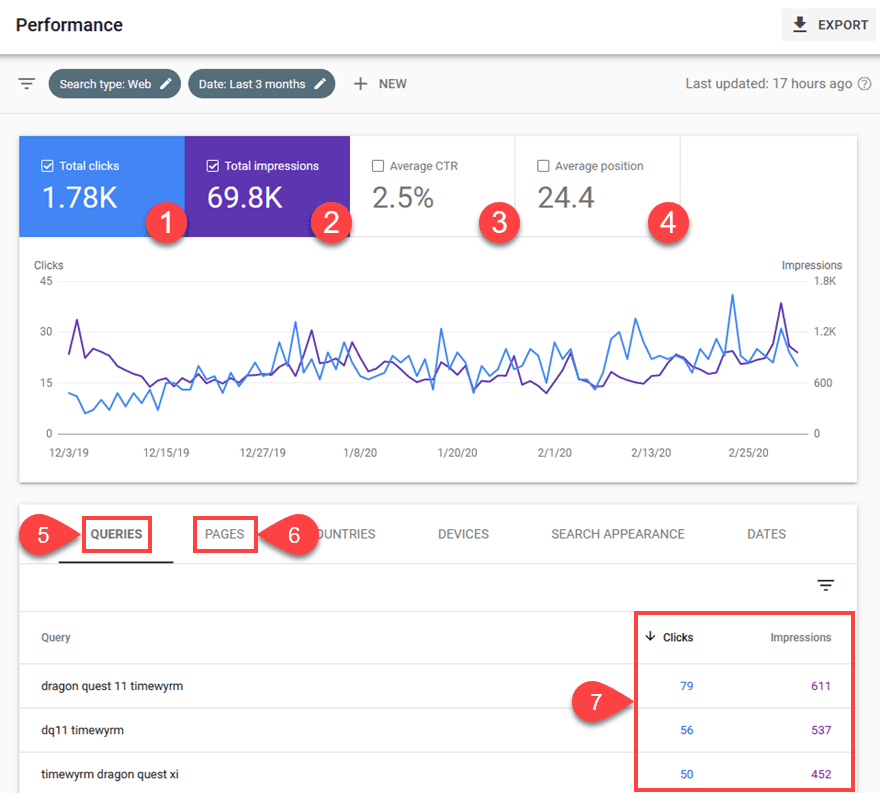
While there are a lot more than seven data points on this report, the seven that we highlighted in the above image are some of the more useful pieces of information for the majority of search console users. Remember, GSC does not give Google Analytics style numbers for the website as a whole. It provides info for your appearance in Google Search results.
- This box indicates the total clicks your site has received as it appears in search results. This is simply the number of times someone has seen your link and clicked to your site.
- Total Impressions, however, is the total number of times your website appears in search results. Whether they click or not, your site at least appears in the results for this number of people.
- Average CTR is the click-through-rate at which those who get the impression of your site actually click into it. You want this, obviously, to be as high as possible. According to Backlinko, the average CTR for the #1 result is 37%. Beyond that, it slides down to 2-3% for ranks below 5.
- Tying into your average CTR, the Average Position shows you the average rank of your site in the results. This is across all pages that Google indexes, not just your highest ranking ones. So your average might be lower than you want, but your CTR and total clicks are adequate. However, if you find that your average position is over 10-15 (especially over 20), you might consider doing an archive update and SEO audit to hit more volumetric keywords.
- The Queries tab is simple: these are the top searches that users typed in to see your site in results. You can then mine these keywords for off-shoot content that ties back into more cornerstone/pillar articles that are already attracting attention.
- The Pages tab is almost identical to Queries. Except that instead of keywords, it shows the actual pages people are seeing and clicking into.
- The Clicks/Impressions columns tie into numbers 1-3 a lot because they are basically the individual breakdowns per query and per page. You can see how many times each search query brought up your site and how many times users clicked that link. The Pages tab has these as well, only for the individual pages.
By drilling down into these metrics you can better understand how searchers see and react to your site. With that in mind, you can then leverage Moz and SEMrush and other tools to better optimize your site and increase conversions.
The Discover Tab
Now, some websites will show a tab under the Performance card that others won’t: Discover. This tab only appears, according to Google, “as long as your data reaches a minimum threshold of impressions.”
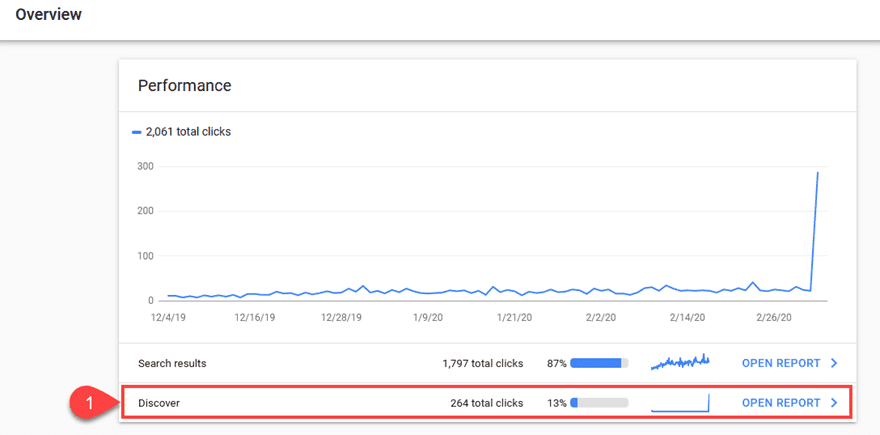
As you can see in the image above, the Discover performance suddenly begins at the latest date. This made the tab appear for this particular site. The site is new, and the threshold appears to be roughly 1,000 impressions over 16 months. There seems to be nothing a website owner can really do to be featured in Discover other than to create good content, to use high-quality (and high-resolution images larger than 1200px), and to make sure all of your major pieces of content are indexed by Google using the URL Inspection Tool (which we will cover below).
As you can see, the Discover report is the same as the general Performance one. It just handles impressions and clicks from when Google features you. And as you can tell (these screenshots are taken within 2 days of each other), the conversion rate of the Discover links are much higher than average search results (because it’s curated content).
URL Inspection
The final aspect of the Performance section of the Google Search Console is called URL Inspection. It’s important to note that you are not inspecting the primary domain (ex: example.com), but rather interior pages and posts (ex: example.com/blog-post-3).
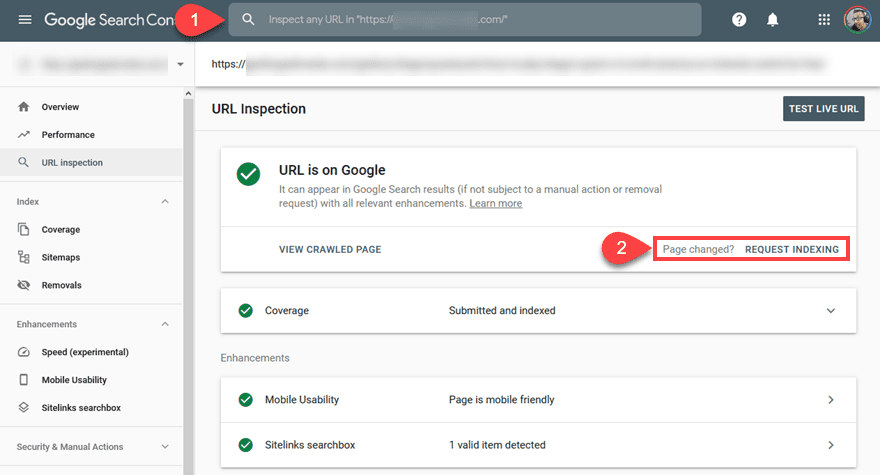
This report gives you access to the most important information regarding your site: is it indexed by Google?
If you have green checkmarks, then congratulations. You’re indexed by Google. You can also see how your URL appears to Google via sitemaps and the sitelinks.
The big feature of this page, though, is the Request Indexing link. If you have made major changes to the page, such as updated and modernized content from years ago, inserted higher-quality images for a tutorial, or any other kind of substantial change, it is in your best interest to head back over to this page and click the Request Indexing link.
What happens next is out of your hands. But Google crawlers will head over to this particular URL and re-index it. This makes sure that all the new content is showing up in results. Your Page Rank will likely also improve if you’ve done substantial and quality edits.
The Coverage Report
The second card on the Google Search Console dashboard overview is Coverage. And again, it also lives in the left-hand sidebar, just under URL Inspection. The Open Report link takes you to the same page, as before.
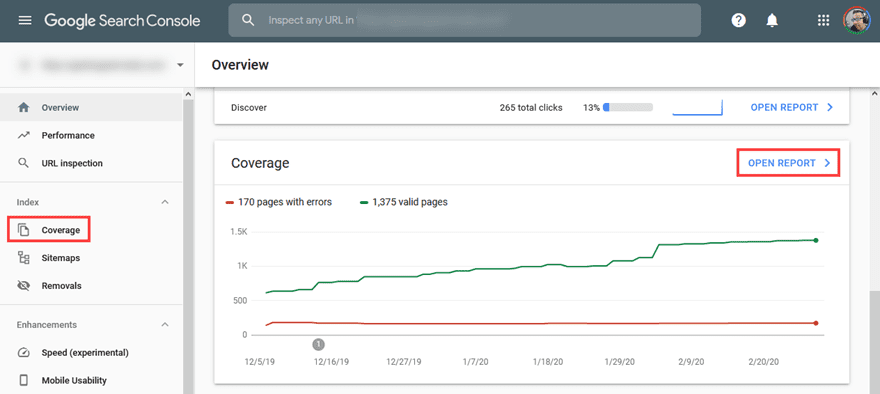
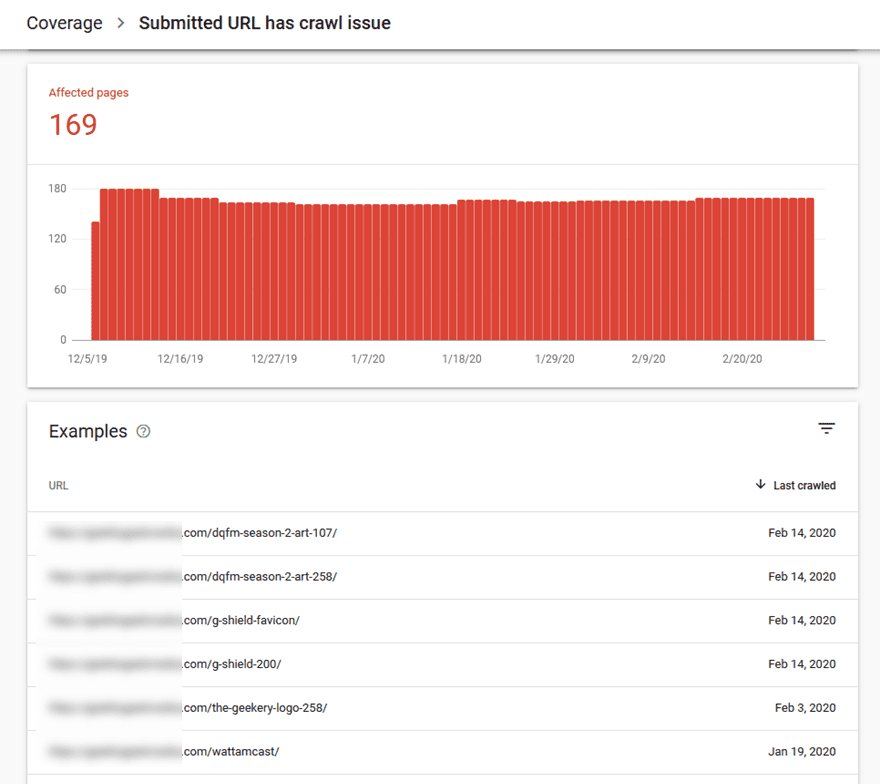
The overview card gives you the primary breakdown of how Google sees your site’s pages. In the example above, 1.3k valid pages exist while 170 individual pages return crawl errors. There are a lot of reasons you might be getting errors. Not all of them are bad. For instance, the URLs that return errors in this example are all media attachment pages not included in the sitemap submitted by Yoast.
When visiting these URLs, they refer now to the individual media items themselves. Which is what we want to be indexed to begin with. Our point is that you might see errors that aren’t anything to worry about.
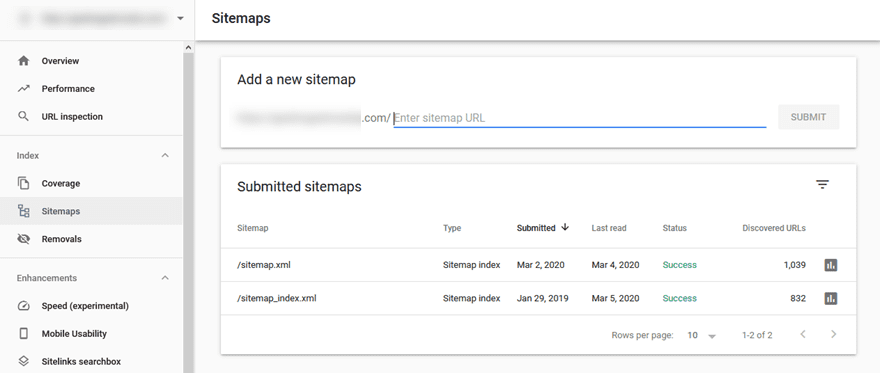
Sitemaps
Probably obviously, the Sitemaps menu is where you can find all of the sitemaps you have submitted to Google to navigate your site. That’s all a sitemap is: it is a document that tells Google how your website is structured. And you absolutely need to give that to Google.
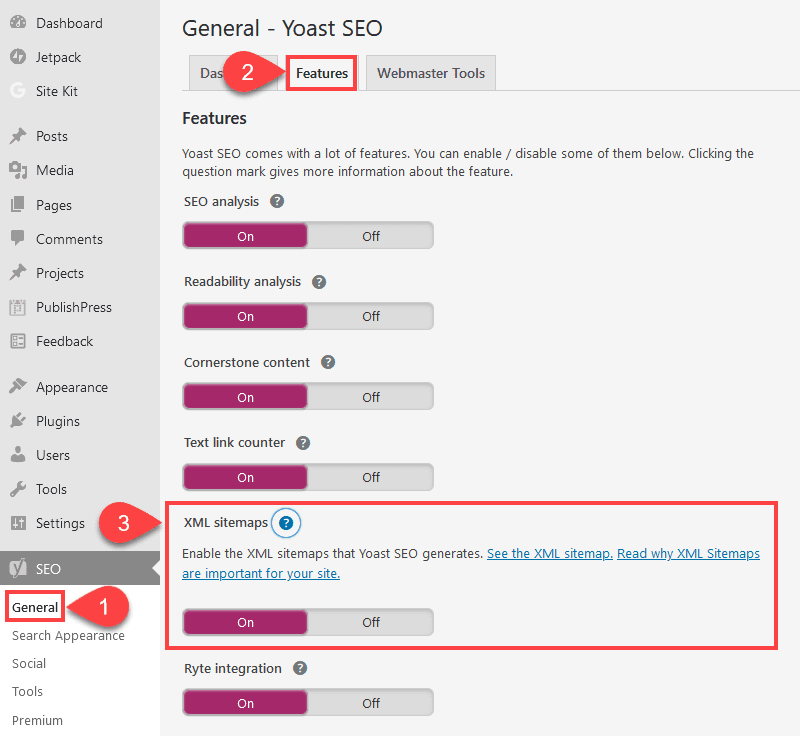
If you use a sitemap plugin like Yoast for your WordPress site, then you can have that turned on automatically. Navigate to SEO – General in your WordPress dashboard. Here, you will find an XML Sitemaps option under the Features tab. As long as the toggle is set to On, Google is going to see how you’ve put yourself together.
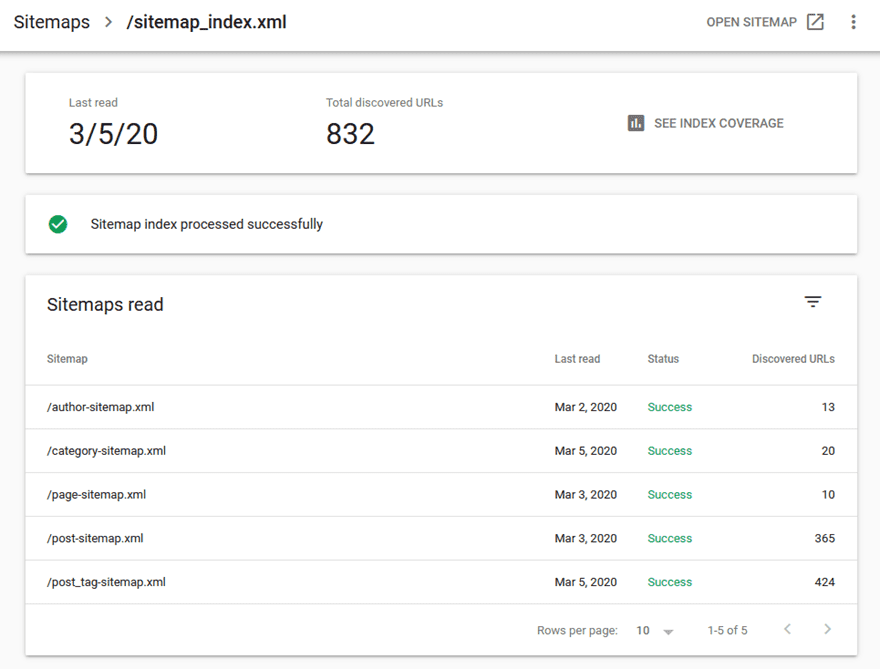
If not, and you have a generated sitemap otherwise, you can just paste that file’s URL where it says Add a New Sitemap in the search console. Regardless of how you do it, in the end, you can check the sitemaps that Google has for you. In this example’s case, we want Google to index the content by page, post, category, author, and tag. So we have multiple files. One for each.
Now we know that Google is aware of how our site is structured, and how it can specifically navigate to the pages we want to be indexed. It is important to remember that while sitemaps aren’t 100% necessary, they help Google find hard-to-find places on your site that may not have lots of internal links or ways to get to outside of direct traffic.
Removing URLs with Google Search Console
Under the Sitemaps menu item, you will also see Removals. Many people will never even touch this section. However, when you absolutely need to make sure that a page on your website is no longer visible (via organic search), you come here to remove it from results. Keep in mind that using the URL removal tool in GSC will not remove the content from the site. It will only make it not appear in searches. You must delete the content yourself.
And if you delete the content yourself, then you should make sure you file a removal request or there will be visitors landing on your 404 page. Then file the permanent request for removal.
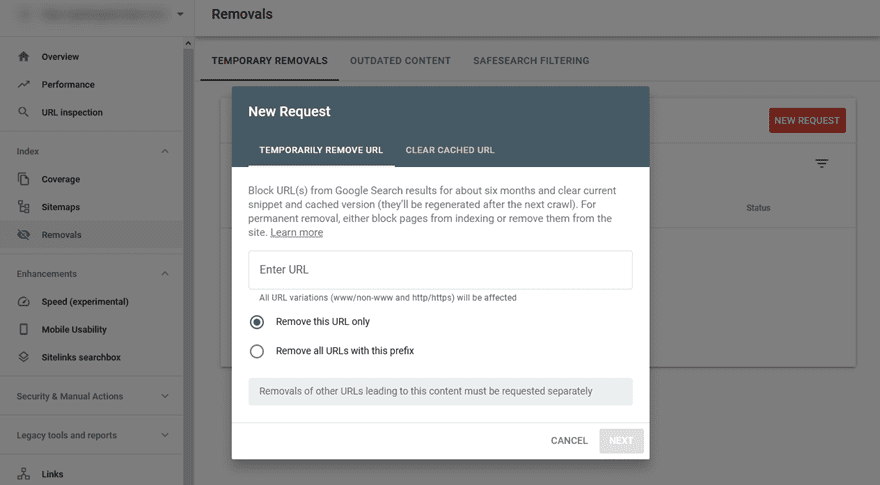
Reasons for using the tool may be copyright cases, sensitive material, and even business transfers. Just remember that you have to own it within the GSC to remove the URL. You can’t request a URL to be removed from a competitor.
Enhancement Tools
The third and final card on the dashboard overview is Enhancement. The reports covered in this section are about what you can do to better improve — or enhance — your website across multiple avenues. Speed being the first, mobile usability, as well as sitelinks.
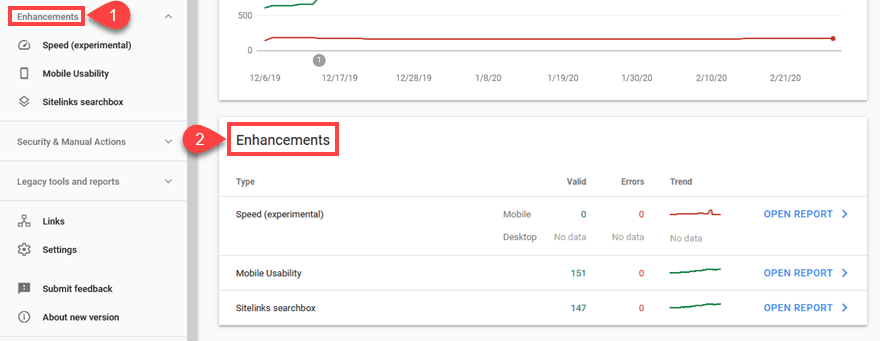
You get a small overview of the data inside each within the card, and you can open the report from there or the sidebar to get more detailed information.
Speed
Labeled as experimental, the Google Search Console speed report gives you two more cards when you enter this area. Mobile and Desktop. Given that mobile speed is one of the primary indicators of Page Rank these days, it makes sense the Mobile is on top. Depending on your site, you may or may not have enough data for the card to show Desktop data. All that means is that your traffic from that device isn’t enough. There’s a small chance it is because it’s set up incorrectly, but either way, you can use the Google PageSpeed Insights tool to get a full view of the desktop ranking. Though many feel that speed testers such as Pingdom and GTMatrix are more reliable.
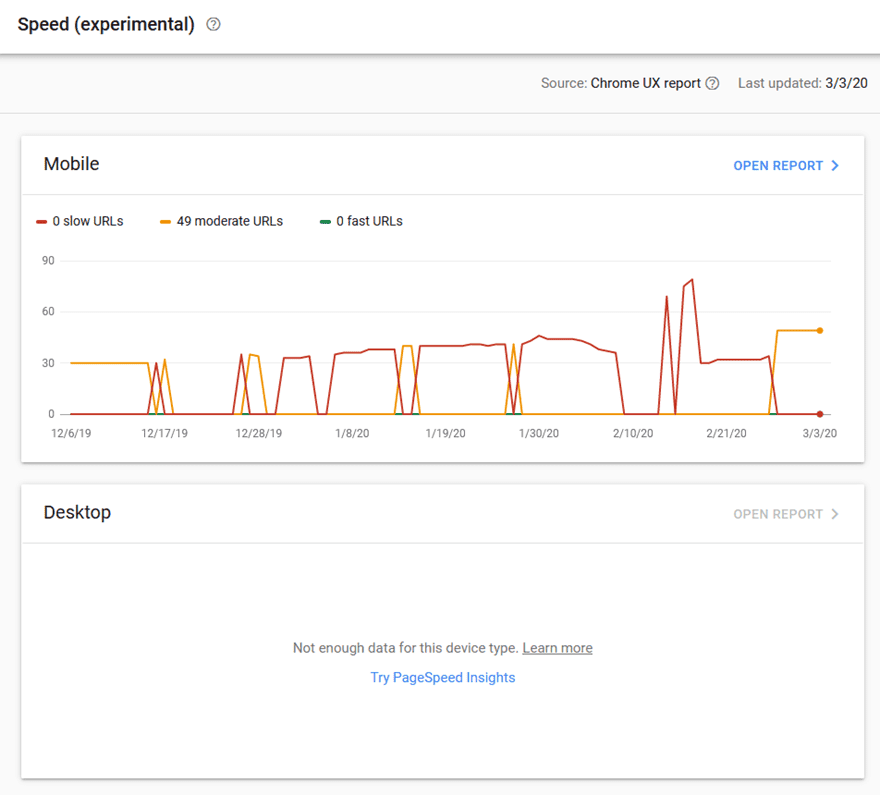
The actual speed reports themselves are simple to understand. It’s broken down into three categories: slow pages, moderate pages, and fast pages. Slow pages are considered anything on your site that takes over 3 seconds to. Moderate pages are between 1 and 3 seconds. Fast pages have under 1 second load times. While this page gives a lot of insight, you can drill even further with Open Report on either card.
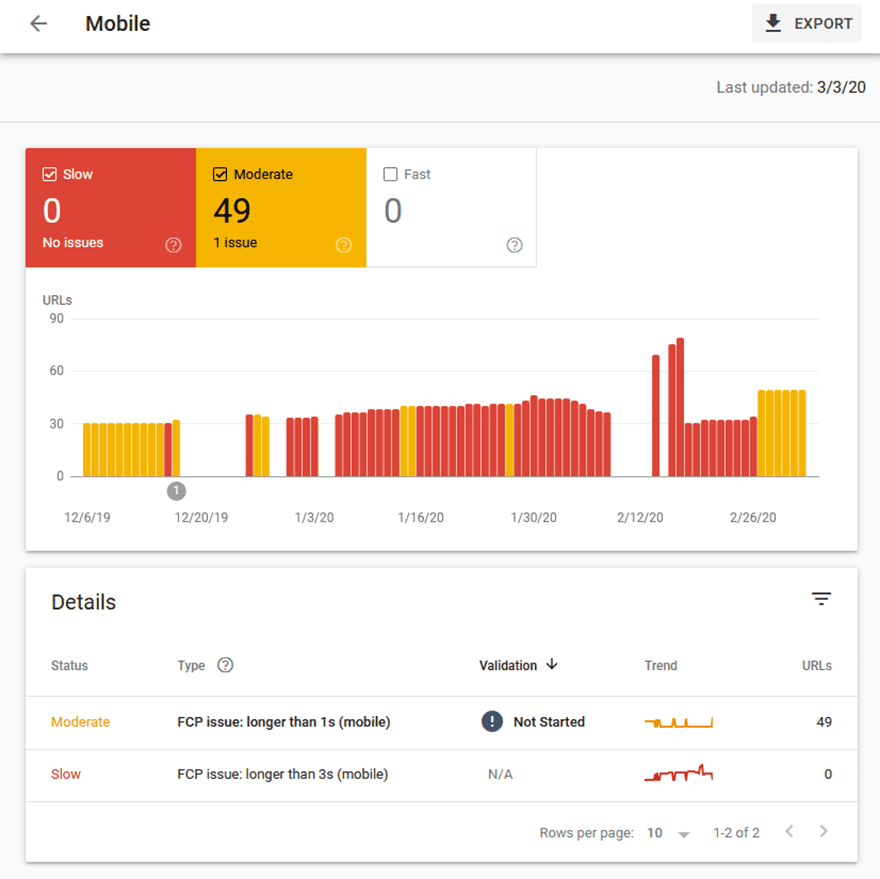
The numbers in this report aren’t indicative of how fast the pages are, but rather the number of pages within each group. You can see where your issues lie and can then go into pages on an individual basis and adjust them as they need (perhaps image cropping and resizing or removing scripts, etc.).
As you can see in the above mobile report, in mid-February, the site incorporated a new caching plugin, moving all the indexed pages to Moderate from Slow. With a few tweaks, the site admins haven’t taken the time to make because Page Speed has typically run at about 1.5 seconds.
Our point is that just because you have a Moderate rating doesn’t mean that it’s bad or even cautionary. But it’s an indication that it could be better if you take a few steps. Which is what Google Search Console exists for: tracking down individual points that can improve your search rankings.
Mobile Usability
The Mobile Usability report in the search console is really straightforward: you learn which pages on your site are mobile-friendly. This means both in terms of page speed and UX.
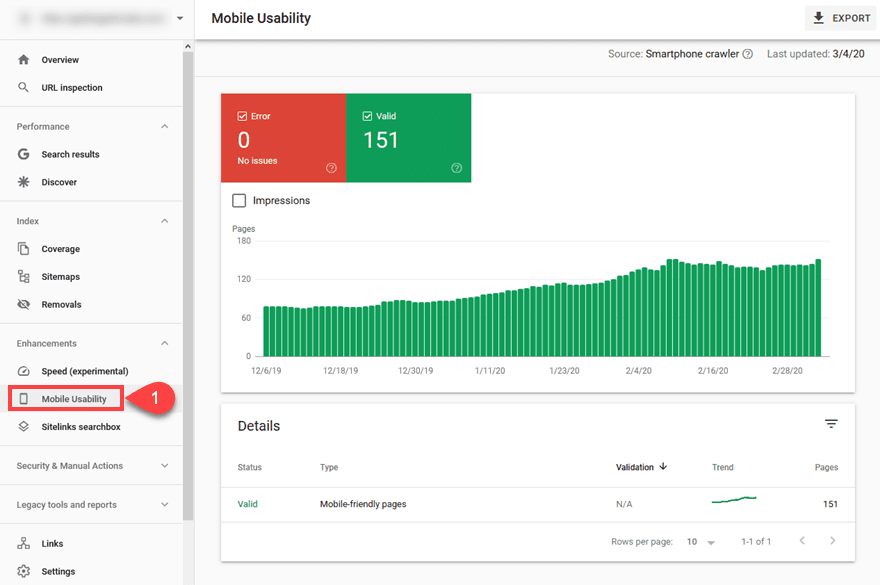
Many themes (such as Divi) are automatically responsive these days. Therefore, you may not ever have to dig any deeper into this report than simply checking to see if your site is responding to the smartphone crawler. However, if you do happen to see any errors here, you can narrow down the problems.
In our experience, many problems come from having entirely separate mobile sites that aren’t optimized for the current web standards, as well as having CSS errors that use absolute sizing on one or more elements, making the content display in a way that smaller viewports cannot see or read the content because of increased horizontal scrolling, as an example.
Sitelinks Searchbox
Sitelinks are, again, one of those reports that you will mainly use to check on things being okay, rather than digging into to create action plans. This indicates how Google sees your site and determines if there are interior pages that are worth displaying as secondary links in results.
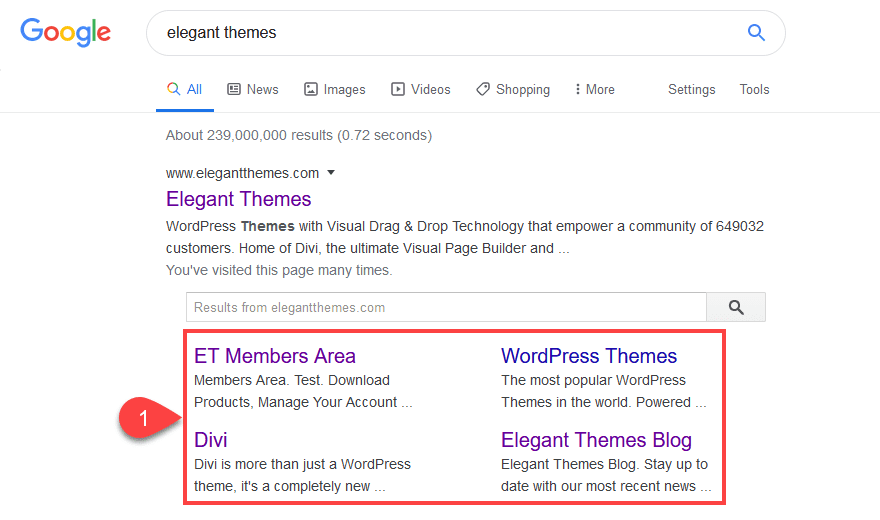
You use the report for sitelinks in the Google Search Console to make sure that all of the meta fields and optional data are available for Google to sort through.
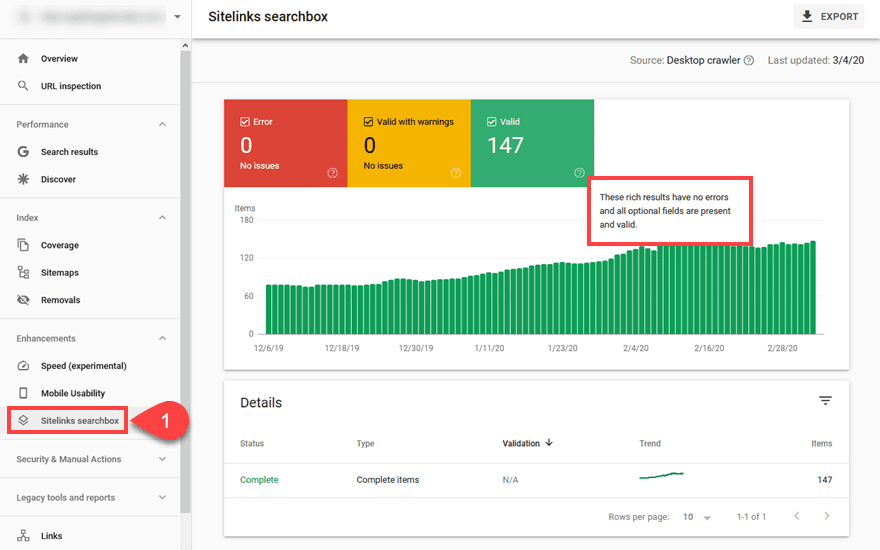
You can’t choose if Google provides sitelinks for your site. However, you can verify that the information is there for the crawlers to use as they see fit.
Security and Manual Actions
The Security and Manual Actions items in the left-hand sidebar will hopefully remain empty with a No Issues Detected message for the vast majority of your site’s life. In fact, many sites (perhaps even most) will never have a manual action taken against their site.
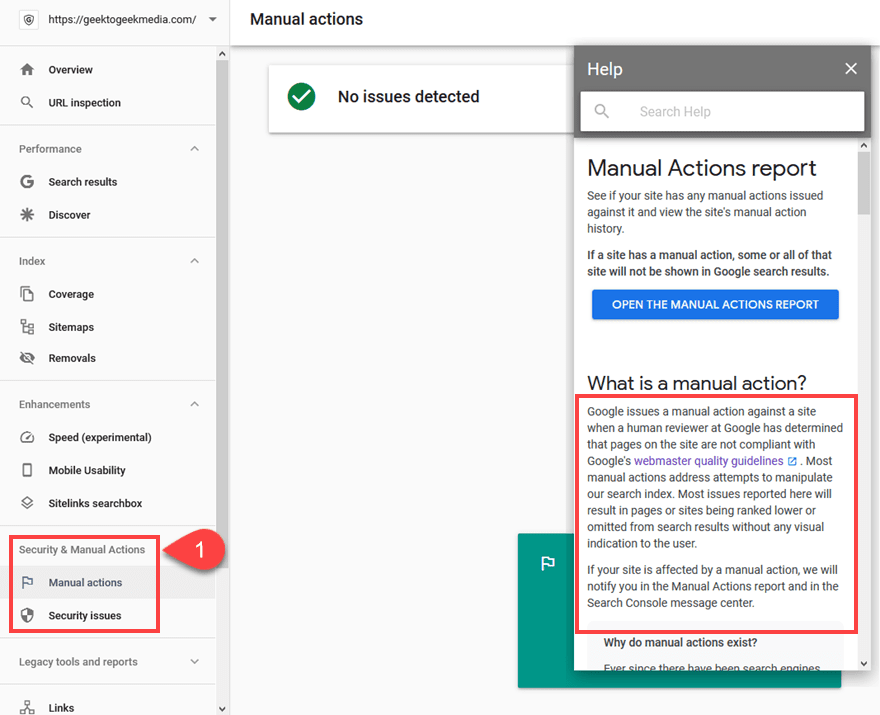
However, in the case that a “human reviewer at Google has determined that pages on the site are not compliant with Google’s webmaster quality guidelines,” you will be notified here as well as the notifications bell/message center in the search console.
Basically, if you’re not taking advantage of spamming techniques or Black Hat SEO practices, Manual Actions won’t be an issue for you.
Regarding Security Issues, this is where you will see notifications about any malicious code or malware that Google detects. It might be found by Google’s crawlers or reported by users. Either way, if there is a concern regarding your site, Google will let you know here. In that case, you can use the information to conduct security audits of your site.
Legacy Tools and Reports
The version of the Google Search Console that we’re working through in this article is the new, updated version. There is a Legacy version that still has a few tools that haven’t been converted and those are the ones listed here. In general, these are for advanced users who need very specific tools to perform very specific tasks. The reason they have not been converted to the new console is that they have been improved (such as Messages) but some still like the old UI or not useful to enough people to warrant a change but still hold value to a segment of the userbase (such as International Targeting and Crawl Stats).
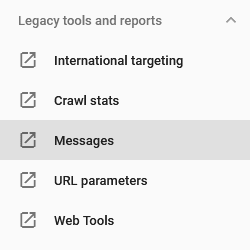
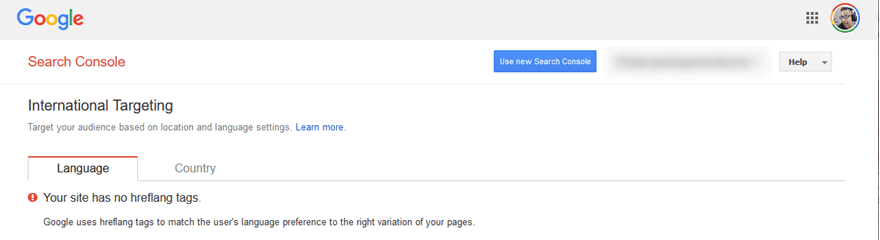
International Targeting
Use this tool when you’re using hreflang tags to localize content on your site. WordPress users can integrate this pretty easily using WPML (or one of the other top translation plugins), but it is far from necessary. However, if you choose to, this is where you will go to check the stats and performance of those alternate pages.
Crawl Stats
Google says this tool is for those interested in advanced SEO techniques and analytics. You can see the number of pages that Googlebot has crawled in the past 90 days, how many kilobytes of data it downloads from the site per day, and how much time it takes for that data to download.
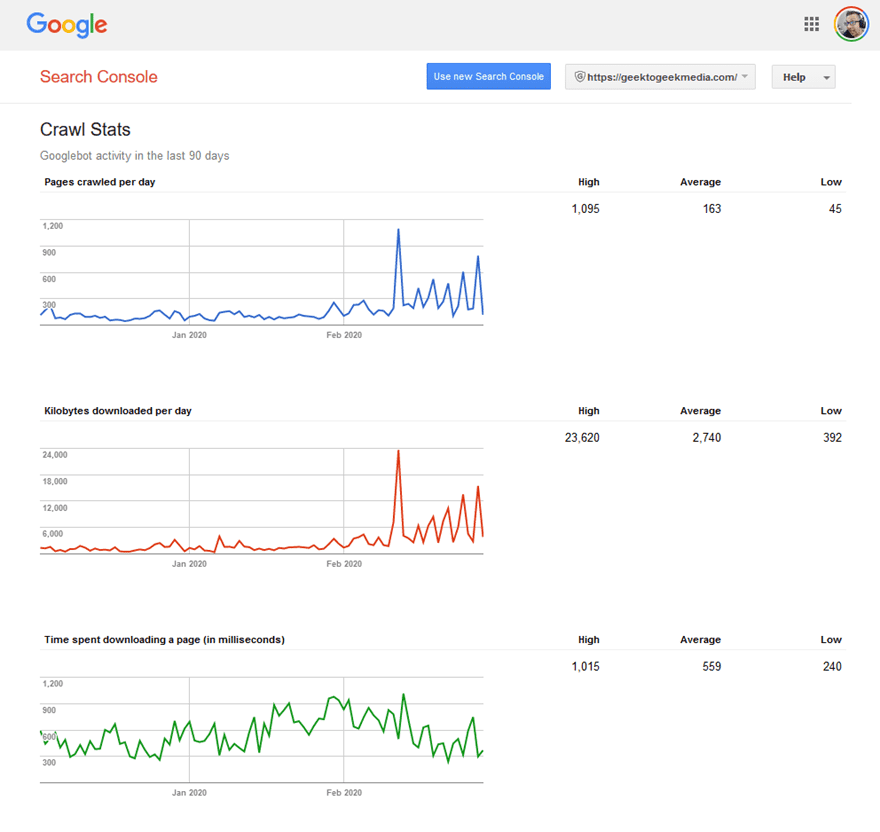
The documentation for the Crawl Stats tool says, “If your site is being overloaded by Google crawl requests, you can track the issue here, and request a reduced crawl rate.” It can also be done the opposite direction, too. If you have seen a lowered rate, then it’s a good idea to request indexing and crawling again.
Links
The final tool in the toolbar, though certainly not the least powerful is the Links report. From here, you get a list of external domains linking to your site, external pages linking to you, internal pages that you link to, the top sites that link to you overall, and the top anchor text used to direct users to your site.
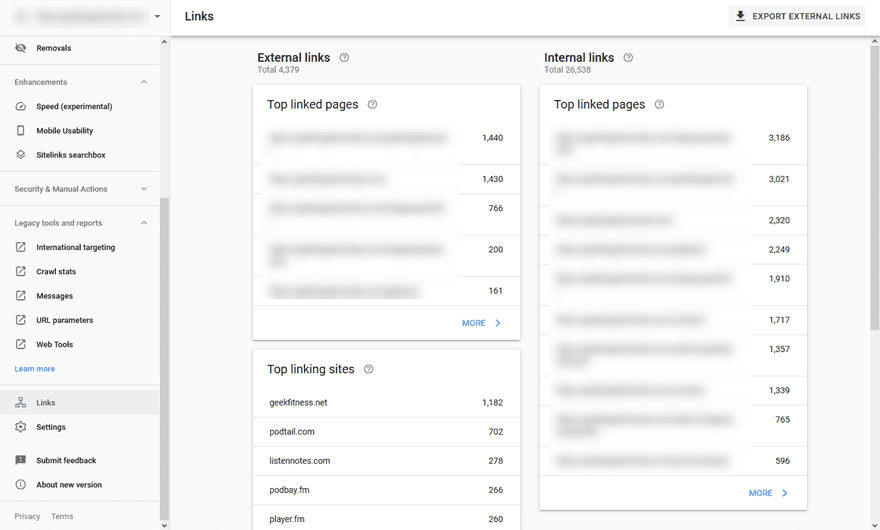
You can expand each of these into a full report.
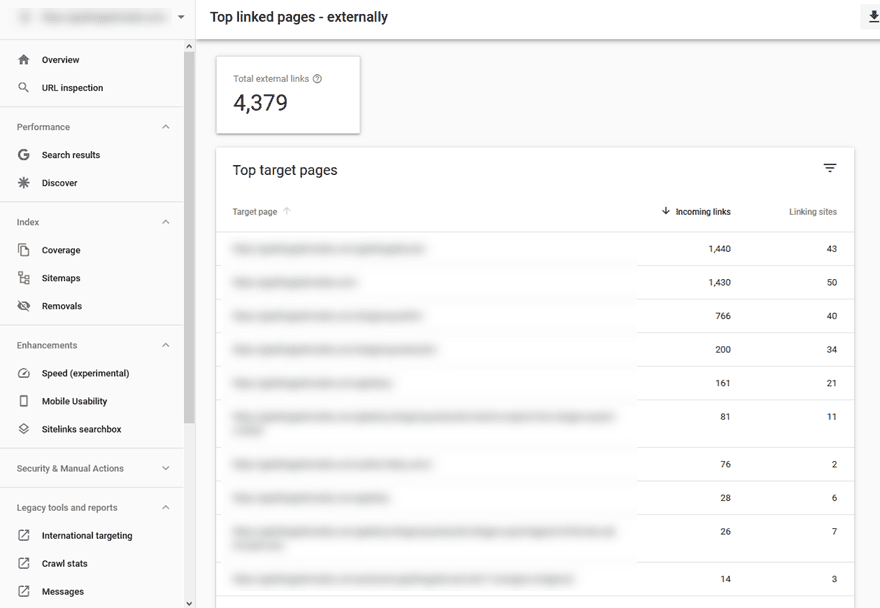
Using, for example, the Top Target Pages from external sites, you can see where the most relevant content you’re creating lies. Most often, you see their homepages or particular top-level pages here. They are the most linked-to. Sometimes /about or /pricing or /store will be near the top. The top of the page shows the target URL, the total number of links back to it, and the total number of unique sites that make up that list.
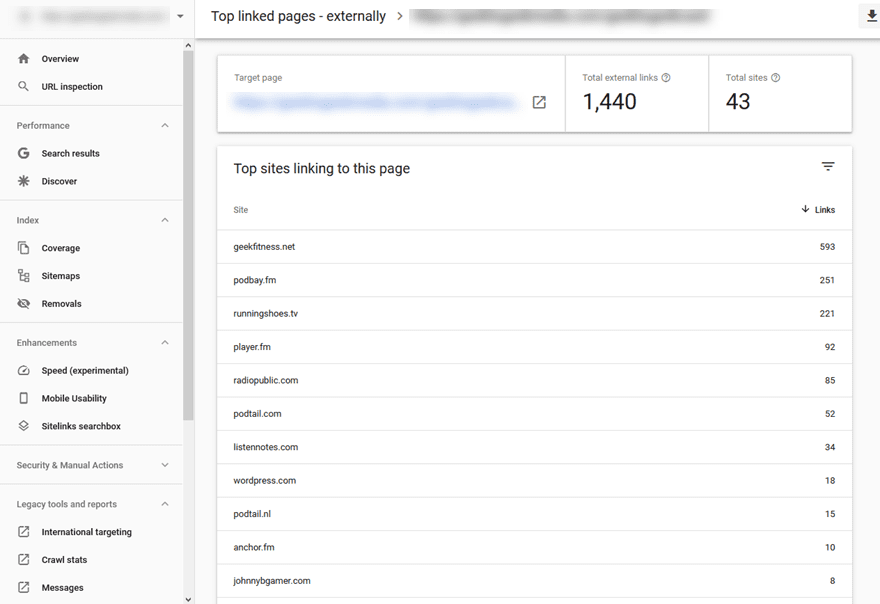
You can click into any single URL to see a breakdown of all the sites that link to that specific URL.
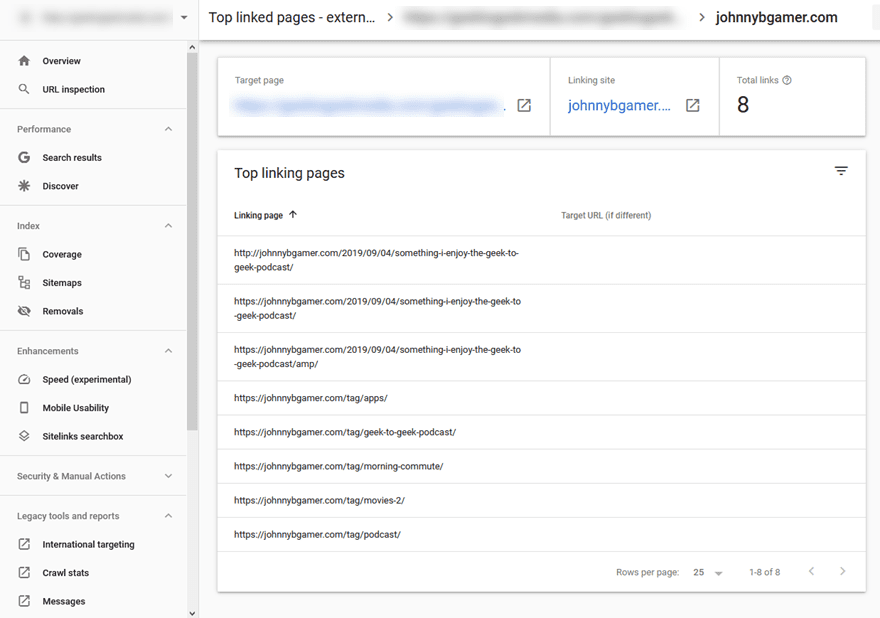
In this report, you will see the unique pages on that site that link to yours. This sort of list will give you an idea of what people are saying about your content, as well as giving you opportunities to create relationships that will drive even more backlinks to your site and could bolster your business and brand in other directions, too.
Top Linking Text is also worth taking a look at. As people link more often to your site, you can see the anchor text they use.
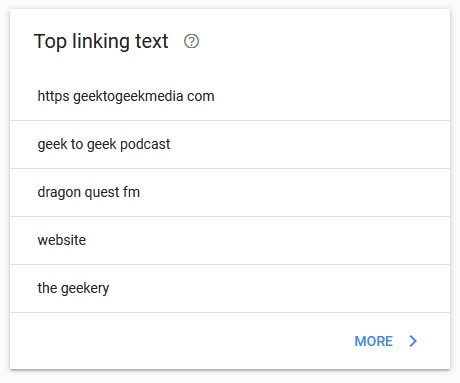
This tool and the full report is an excellent way to find keywords that can bolster your rankings, and even come up with additional ideas for content based on various anchor texts that seem popular among other websites.
Conclusion
That’s a lot. We know. The Google Search Console is one of the most powerful tools that you have access to online. Learning it can take some time, and getting good at digging into the metrics can take even longer. However, as you become more acquainted with all of the features and tools and analytics we’ve covered above, you will be able to take your website from good to great or from great to amazing. Whether you need to adjust a single page’s campaign to make it rank higher or simply find the best backlinks you have to build relationships with other site administrators, Google Search Console allows for that. There isn’t much it doesn’t allow for, really.
What do you use the Google Search Console for the most?
Article featured image by Sammby / shutterstock.com


The search console has been updated, But this is a nice post. By the way, it explained very nicely.
I just wanted to know whether search console gives all the backlinks info?
Hi,
I didn’t know how powerful Google Search actually is. I’ve checked it before to see if my blog was listed in Google. I’ll be using a lot more of the features.
Thanks for sharing so much and it’s very helpful.