
Heatmaps can be extremely useful tools. They enable you to track user behavior on your website, in ways that mere numbers often have a hard time representing. With a heatmap, you can visualize your visitors’ journey through your content. This enables you to quickly identify pain points, so you can improve their experience.
Although WordPress doesn’t offer heatmap functionality out of the box, you can easily add it to your website using plugins. In this article, we’ll dig deeper into how heatmaps work, why you should be using one, and what your options are as a WordPress user.
Let’s get to it!
An Introduction to Heatmaps
These days, you can track all kinds of data about how visitors behave on your website. You can see which pages they spend the most time on, what links they interact with, how far down each page they scroll, and much more.
Most of that data comes to you in the form of numbers. In some cases, it can be hard to visualize what it all means. For example, you may know which of your pages are the most popular. However, that tells you nothing about why that particular content resonates with visitors.
Heatmaps enable you to take a different approach, by creating a visual representation for some of your website’s analytics. Most often, that representation comes in the form of an overlay on top of your pages:
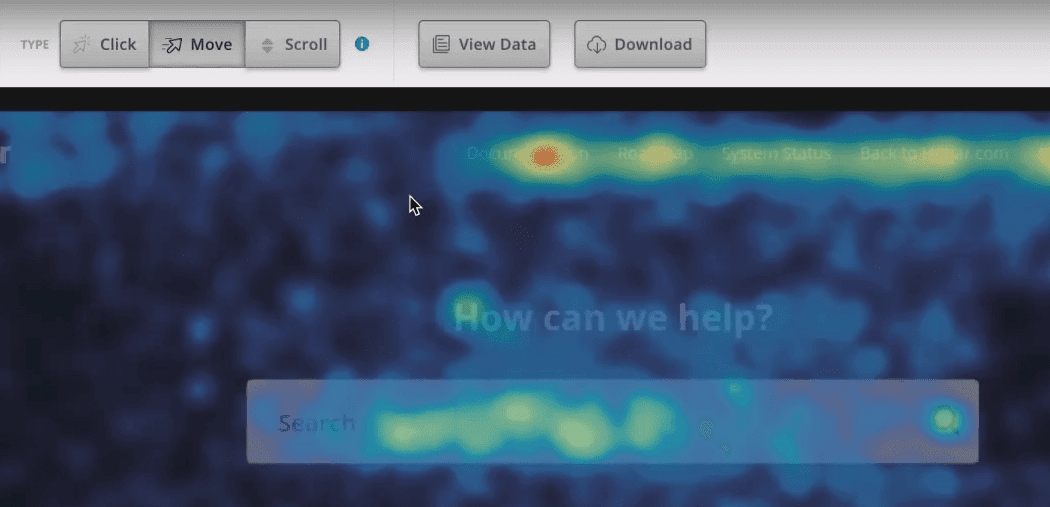
In the above screenshot, you can see that specific areas of the page are highlighted in warmer colors. Heatmaps use a simple color gradient that moves from colder to warmer colors. The ‘hotter’ the color is, the more attention and interactions that specific part of your page is getting.
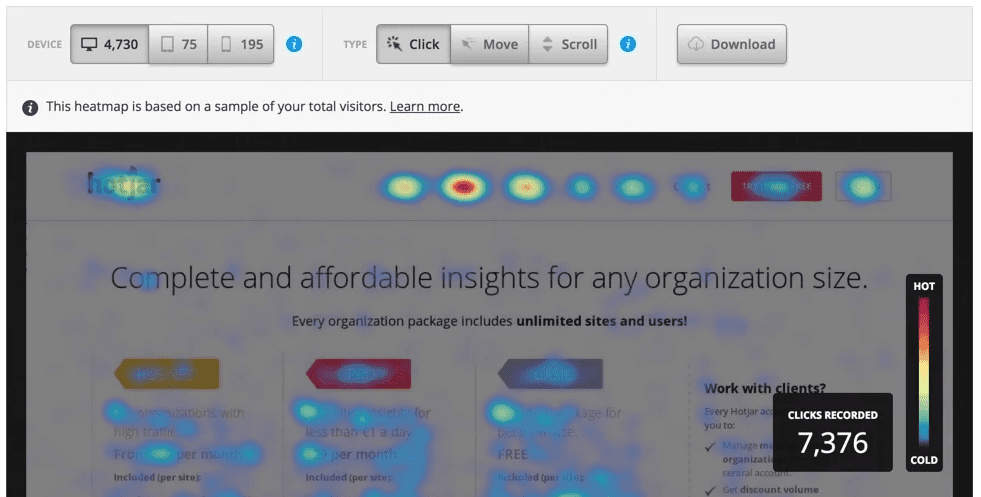
The previous example demonstrates what is known as a ‘click’ heatmap. There are several kinds of heatmaps you can use, and we’ll dig into the other types later. With a click heatmap, you get a visual representation of which elements on your page visitors are most interested in:
Most modern analytics tools throw entire libraries of data at you. However, heatmaps enable you to gain a much more intuitive grasp of your users’ behavior. If you can determine at a glance what elements on your pages are drawing the most attention, there are a lot of insights you can glean from that data.
Before we move on, it’s important to mention that heatmaps aren’t just excellent tools for website analysis. Heatmaps are everywhere, from weather reports to statistical analysis, financial market visualization, and more. Those applications make for interesting reading. We’re here to talk about websites, however, so let’s discuss the benefits of that use case.
Why Heatmaps Can Help You Improve Your Website’s Quality
As we mentioned earlier, heatmaps are fantastic if you want to approach web analytics from a different angle. Depending on what information you want to prioritize, there are several different types of heatmaps you can use.
We’ve already talked about click heatmaps. With enough data, click heatmaps can tell you what areas on your pages are ‘hotspots’. Ideally, you want those hotspots to line up with critical elements, such as Calls to Action (CTAs), products, links, and more:
If you don’t see enough activity surrounding key elements on your pages, it can point to User Experience (UX) issues, optimization problems, poor copy, and various other causes. That brings us to a key point – heatmaps don’t tell you exactly what you need to fix. However, they do a great job of pointing you in the right direction. If your newsletter signup button isn’t getting much activity, you know that’s an element that needs to be tested and addressed.
Moving on, you can also benefit from using ‘scroll’ heatmaps. This type of heatmap shows you how far down your visitors are scrolling before they bounce (leave the page):
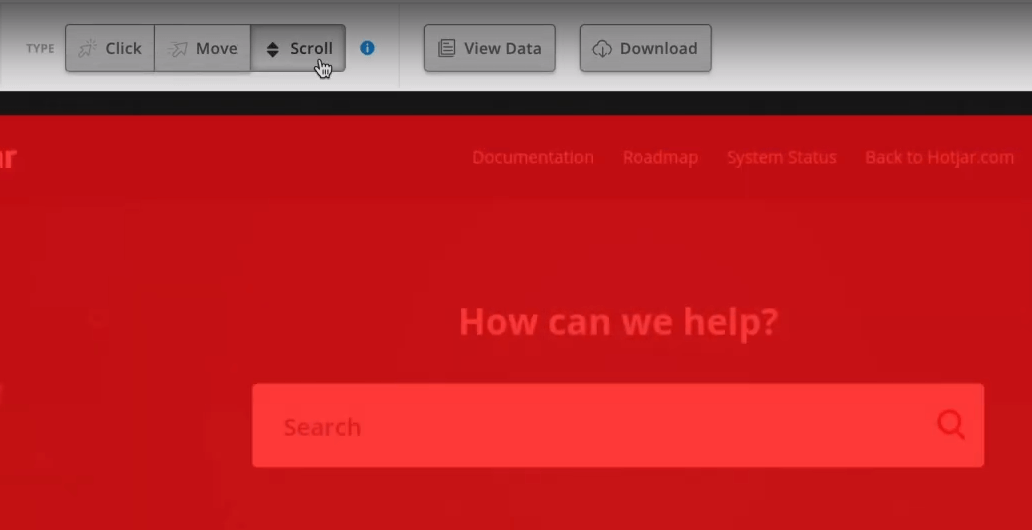
Ideally, you want the warmer areas of the map to be as far down as possible, or to line up with where your page’s key elements and CTAs are. If the warmer areas are at the top, that usually points to issues with the page’s UX. For long-form content, if your heatmap shows that visitors aren’t scrolling down to continue reading, you might want to rethink your content strategy.
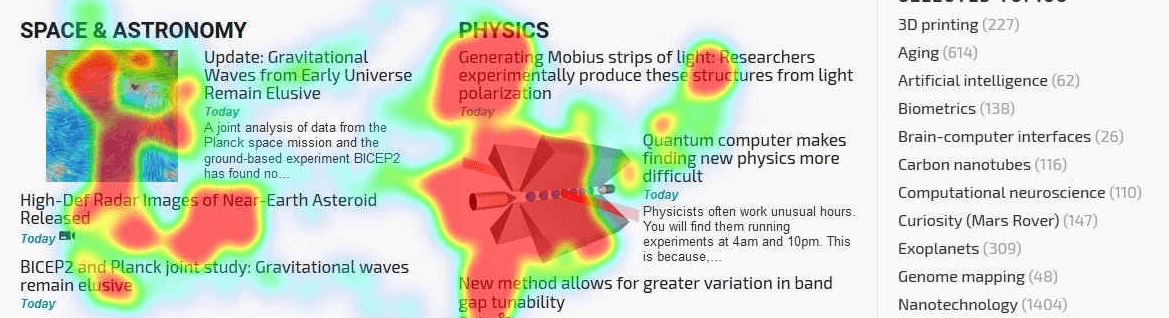
If you want to more specific information about user activity, confetti reports might be more to your liking. This type of heatmap shows you individual clicks throughout your pages. The warmer the area is, the more users have clicked on it:

Confetti reports can be incredibly useful for figuring out what precise elements visitors click on. In many cases, you’ll notice that users try to click on elements that aren’t interactive. That can points towards poor design choices.
This type of heatmap can also give you excellent insights into the checkout process if you’re running an online store. You’ll want to streamline the checkout experience as much as possible, and figuring out what visitors click on while making a purchase can help you perfect it.
There are very few websites that can’t benefit from using heatmaps, particularly if you run A/B tests regularly. When you combine A/B testing with heatmaps, you can get quick and accurate insights about which versions of your pages perform better with your target audience.
Of course, in order for heatmaps to provide you with accurate information, you’ll need enough data. A handful of visitors is not an accurate representation of your audience. If you’re going to make decisions based on data, it needs to be statistically relevant. Therefore, it’s a good idea to set up a heatmap solution as early as possible. Then, you should give it plenty of time to track user behavior and generate accurate results.
3 Top Heatmap Plugins for WordPress
Heatmaps require data to work. That means you’ll need an analytics engine that integrates with your website, collects user information, and generates heatmaps based on it. With that in mind, let’s look at a few of the top solutions for WordPress users. Two of the three plugins we’re going to cover here require you to sign up to a third-party service. So you’ll want to keep that in mind while assessing your options.
1. Aurora Heatmap

Aurora Heatmap is the only recommended WordPress heatmap plugin that doesn’t require you to sign up for a third-party platform. With Aurora Heatmap, you can simply set up the plugin and get access to click heatmaps for all of your pages. Plus, you can view separate heatmaps for both the desktop and mobile versions of your content.
The premium version of the plugin also includes scrolling heatmaps, and it retains data for longer. Data retention can come in handy, since it enables you to analyze how users behave differently over time and across multiple versions of your pages.
Key Features:
- Set up click heatmaps for your pages
- Generate both desktop and mobile heatmaps
- Keep track of the number of clicks on your pages
Pricing: Free, with premium plans starting at $19.90 per month | More Information
2. Crazy Egg

Crazy Egg is a heatmap and A/B testing service that you can integrate with WordPress, using either a tracking script or an official plugin. If you’re comfortable adding code to your website, you might want to go with the former approach. After all, the plugin’s sole purpose is to add the tracking script for you.
Once you’re set up with a Crazy Egg account, and it’s fully integrated with WordPress, you can generate click, scroll, and confetti heatmaps. Even better, the platform enables you to record individual user sessions.
That means if at any point you have problems interpreting what the data is saying, you can dive into real user sessions to find out how they’re behaving. Since we’re talking about an external service, though, you’ll need to access your heatmaps and user recordings from the Crazy Egg platform.
Key Features:
- Generate click, scroll, and confetti heatmaps for your pages
- Integrate with WordPress using either a script or a plugin
- Record individual user sessions
Price: The plugin is free, and Crazy Egg’s plans start at $24 per month | More Information
3. Hotjar
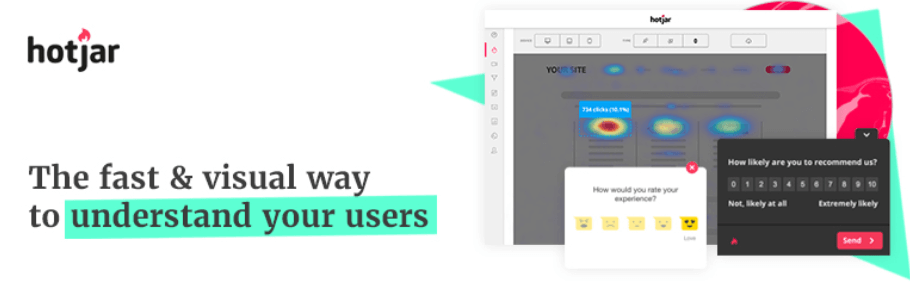
Hotjar is a web analytics platform with a focus on heatmaps, user recording, conversion analysis, and surveys. What the plugin does is help you integrate your Hotjar account with WordPress, by using your unique Site ID.
Once you integrate WordPress with Hotjar, you can generate click, scroll, and ‘move’ heatmaps for your pages. The platform enables you to quickly jump between each type of heatmap, as well as desktop and mobile pages. Just as with the previous plugin, Hotjar also records user sessions. It even enables you to take notes and tag videos so they can be easily categorized.
Key Features:
- Generate click, scroll, and move heatmaps
- Integrate with WordPress using a plugin in a matter of minutes
- Review mobile and desktop versions for all of your heatmaps
- Record individual user sessions
Price: Free plan available, with premium options starting at $29 per month (the plugin itself is also free) | More Information
Can You Use Google Analytics to Generate Heatmaps?
As you know by now, in order to generate a heatmap, you need an analytics engine. Considering that Google Analytics is the most popular option on the market, it makes sense that you might want to use it.
Here’s the issue, however – Google Analytics doesn’t offer heatmap functionality out of the box. That’s not a deal-breaker, considering how much data the platform offers you. However, it does pose a problem if you’re not looking to add a second analytics engine to your website.
There are a few workarounds that enable you to generate basic heatmaps using Google Analytics. For example, you can use Google Tag Manager to track click events, and generate visual reports with Data Studio. The advantage of this approach is that you don’t need to use any external services outside of the Google family. However, generating anything beyond very simple heatmaps is next to impossible.
A second alternative is to use a service such as Crazy Egg, which offers basic integration with Google Analytics. Crazy Egg offers a free Google Analytics heatmap generator. All it requires is access to your Google Analytics account. Then it can fetch the data it needs to generate a click heatmap:

This can be a useful approach, if still somewhat limited. Overall, if you want access to more advanced heatmaps, it’s best to sign up for an additional service to use alongside Google Analytics.
Conclusion
You probably already use an analytics tool to get insight into your visitors’ behavior. Any modern analytics platform gives you access to so much information that it can be hard to interpret. Heatmaps help you take that data and make sense of it, in a more interactive and visual manner than charts or graphs.
If you’re already using Google Analytics, the bad news is that the service doesn’t provide heatmap functionality out of the box. To get access to heatmaps for your WordPress site, you’ll need to use a plugin such as Aurora Heatmap, Hotjar, or Crazy Egg. Fortunately, these solutions are simple to set up and use.
Have you used any heatmap tools with WordPress, and what was your experience like? Let’s talk in the comments section below!
Article thumbnail image by octomesecam / shutterstock.com


i tried it few times, but do we need to use it again and again occasionally or just once ?
Great article Will. I hadn’t given much thought to heatmaps but I’m going to investigate after reading this. While I have data on the pages used having the extra that might help why the pages are popular could be a big help. Thank you.
Awesome guide ! Shared it on Twitter 🙂