
Everyone wants to get more clicks and increase their conversions. Given enough time, hard work, and a little luck, anyone can get these numbers up – but why rely on chance when you can figure out exactly what works best through the magic of split testing?
If you’ve been paying attention to the blog over the past few days, you might have noticed the launch of Divi 2.7, and with it, the arrival of the new Divi Leads tool. With the introduction of Divi Leads, you’ll be able to run detailed A/B tests without ever leaving the Divi Builder.
However, in order to execute successful A/B tests, you’ll need to know how to determine whether your results can be considered statistically significant. That’s exactly what we’re going to cover in this article.
A/B Testing With Divi Leads: An Introduction
Anyone with previous experience of WordPress split testing tools will be able to appreciate the simplicity of Divi Leads, which is due in part to its seamless integration into the Divi Builder. With it, you’ll be able to both run and check on the results of your tests without ever leaving the WordPress dashboard.
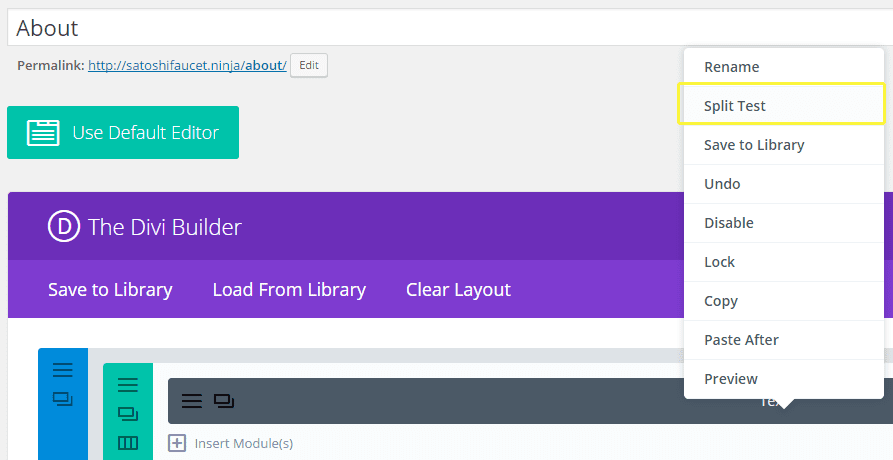
Starting a new A/B test is as simple as right-clicking on whichever module you’d like to choose as the subject of your campaign, then picking the Split Test option:
When you do so, you’ll be greeted with a window explaining the goal selection process for your campaign. Divi Leads enables you to choose not only modules, but also rows and entire sections as individual goals for your tests. Once a goal is chosen, you’ll see a duplicate pop-up on your Divi Builder that you’ll be able to style to your liking for the purposes of the test.
Using Divi Leads, you’ll be able to create multiple variations of the same page from one single Builder window. However, since our interests today lie with A/B testing, we’ll be limiting ourselves to a single variation in order to keep our examples (and the accompanying math) simpler.
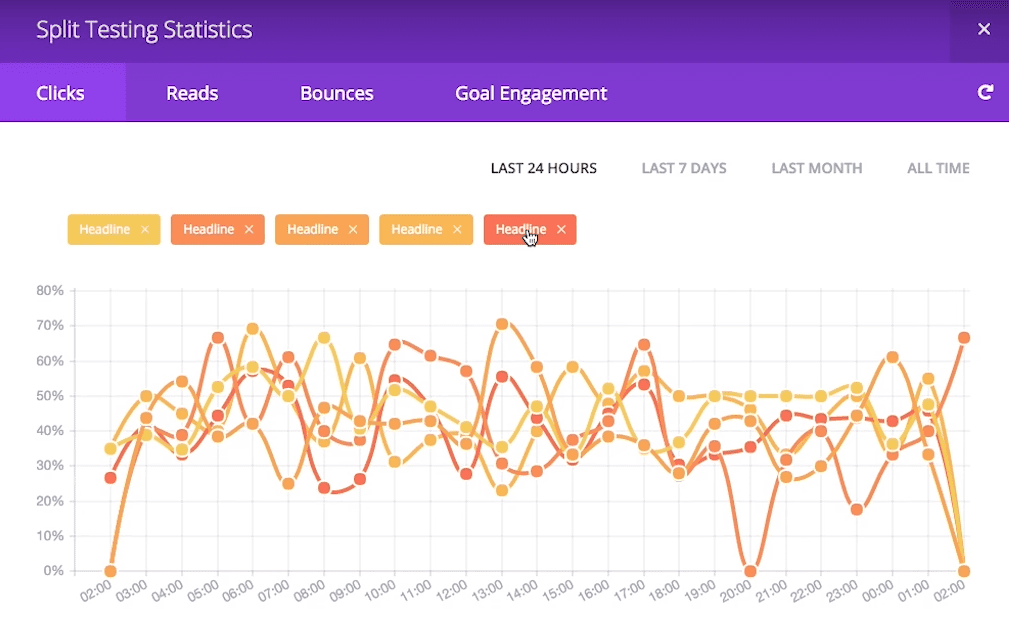
Once you’ve created a variation, you’ll be able to access the Split Testing Statistics window located on the top right of the Divi Builder. Within it, you’ll find detailed information about clicks, reads, bounces, and your goal engagement, as well as helpful graphs for multiple time periods:
You can even check how your A/B test is proceeding without having to open the Split Testing Statistics window, since the modules in question will display the latest click percentages within their titles for the duration of the test:

As soon as you’re certain that you’ve gathered enough data to reach an informed conclusion, all you have to do is right-click on whichever module took part in the test, then click on End Split Test. Afterwards, you’ll be asked to select which subject variation to keep – a process which can’t be reversed, so make sure that your results are conclusive before doing so!
So, now you know how to use Divi Leads, but how exactly does one determine whether any given set of results can be trusted? By making sure the role of chance in your tests has been minimized, of course. Let’s talk some more about this ‘chance factor’.
Statistical Significance and the ‘Chance Factor’ When A/B Testing
Consider the following example: You decide to run a simple A/B test with two variations of a call to action (CTA) on your landing page. A couple of days go by, you receive a few hundred visits (your site is still pretty new), and one of the variations is clearly performing better than the other – an impressive 5% click-through rate, versus a 3% showing from its competitor.
You might think to yourself, Hey, this has been running for a while now, and I think I’ve received enough visitors to call it – let’s go with choice number one! – and why not? After all, the numbers back you up.
The issue here, however, would be that you failed to consider the ‘chance factor’.
What if you ran the same test at another time and the results were significantly different? Or if you decided to keep the test running for a longer period, and the numbers began to swing in the opposite direction with a considerably larger sample pool? Chance plays a role in every A/B test, and the best we can do is minimize it to a level at which we feel comfortable.
In order to do this, you need to establish a level of confidence in your results. This is something you might have read about if you’ve had the chance to go over the results of a multi-participant study. Say that after doing the math on the example test, you realized the results could not be considered statistically significant, and in fact, they would only hold up 50% of the time. Would you be comfortable with that figure?
If your answer was a resounding “No” – great! Let’s teach you how to work out ideal sample sizes with high levels of statistical significance in order to maximize your chances of running a successful A/B test.
How to Determine Statistical Significance When A/B Testing With Divi Leads
The first thing you need to do when trying to determine statistical significance for such a test is establish exactly what level of confidence you would be comfortable with for your results. We’ve personally found 95% to be a sweet spot when it comes to reliability. More specifically, 95% represents an alpha (i.e. a degree of confidence) of 0.05 on the Chi-Squared test of statistical significance, which is the method we’re going to be using today (don’t worry, we’ll explain what that means further along).
Before we go any further, it’s worth mentioning that if you don’t want to go down the route, there are tools available for calculating statistical significance, which we’ve linked to at the bottom of this section.
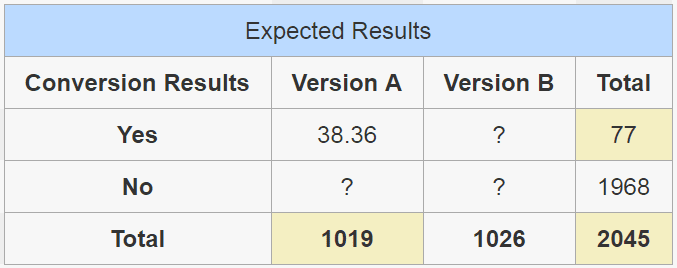
Let’s build upon a similar example to the one we used in the last section. Take an A/B test where we run two versions of a call to action over a few days (the exact length doesn’t need to be taken into consideration for our purposes), and version A ends up coming slightly ahead with a higher total of clicks:
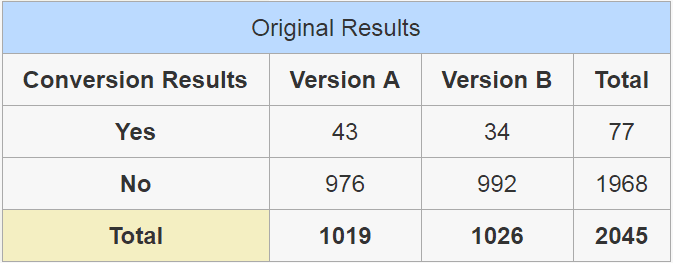
The Yes row in this table shows the number of people who actually clicked on the CTA in question, with the overall total of visitors for both versions at the very bottom. Now this is where things get a little tricky – using the values in the table above, which we’ll refer to as the ‘original’, we’re going to work out the ‘expected’ values of both CTA versions.
Once you see the results we obtain following the expected results formula we’ll be covering below, you might be a little confused as to why we’re referring to them as ‘expected’. This is simply what they’re referred to as far as the Chi-Squared test go, so just think of these as a different potential result for your test derived from the values that you actually observed during its execution. In order to determine the level of statistical significance of our results, we’ll have to calculate four expected values, given the number of variations we’re dealing with:
- the number of people who clicked on version A,
- the number of people who clicked on version B, and
- the number of people who didn’t click on the CTA at all when presented with each choice.
The ‘expected’ value for the number of people who clicked on version A would be the following:
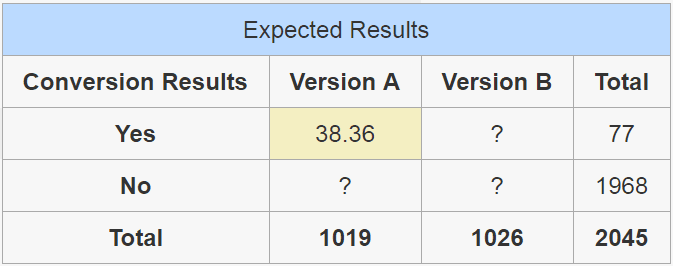
We arrive at that number through the following formula…
(77 x 1019) / 2045
…which is the total number of people who did click on both CTAs, multiplied by the total of people who were shown version A, divided by the total number of visitors to both versions:
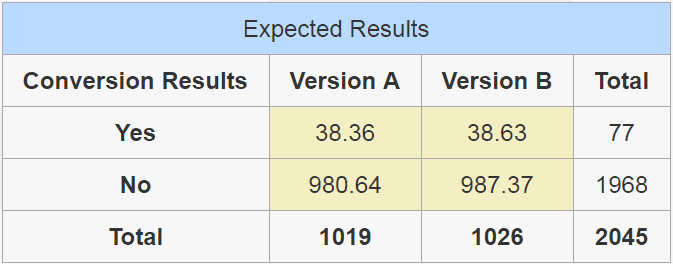
Now let’s repeat that process for the remaining fields. The formula remains the same – all we need to do is take the corresponding total of Yes and No depending on which row we’re working on, multiply it by the corresponding total of said column, divided by the total number of visitors to both versions, and the result should look like this:
If you’re feeling lost, don’t worry – it’s all going to make sense in a minute. We now have both our original and the ‘expected’ results, so naturally we’re going to apply a formula using both of these in order to obtain yet another table. This is the last one, we promise!
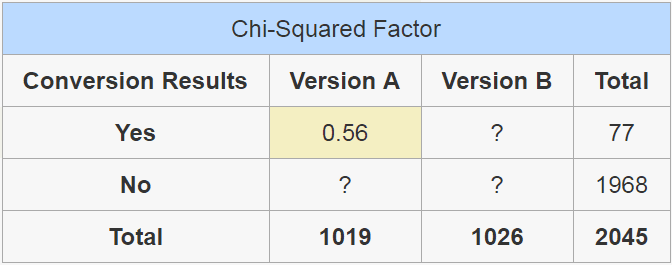
This time, we’re going to be calculating the ‘Chi-Squared’ factor of each individual value we’ve covered so far, enabling us to determine whether our results could be considered statistically significant. To do this, we’ll use the following formula:
(expected value - original value)² / expected value for each individual cell
So in order to calculate the Chi-Squared factor of the people who clicked on Version A of the CTA, the formula would look like…
(38.36 - 43)² / 38.36
…which would result in the following:
Once we repeat the process for all of the remaining values, we’d be left with the following:
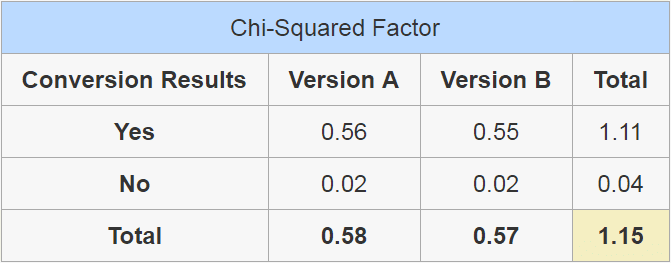
In the end, all we need is a single Chi-Squared Factor – the sum of the total viewers for both versions – which in our case would be 1.15. Now, do you remember how at the beginning of this section we stated we were aiming for a modest 95% degree of confidence, and how that represented an alpha of 0.05? This alpha is a predetermined value on the Chi-Squared distribution table, which assigns the required values in order to achieve a specific degree of confidence depending on the number of variations you need to consider. All tests begin with a hypothetical 100% degree of confidence in order to arrive at your expected level of statistical significance you must subtract the alpha from 1, therefore…
1 - 0.05 = 0.95
…which gives us our desired percentage. An alpha of 0.1 would equal a 90% degree of confidence and so on and on. The smaller the alpha, the more trustworthy your results, and we settled on 95% as our sweet spot, since smaller alphas would require much higher samples in order to return statistically significant values.
According to the table, with a simple A/B test with Yes or No factors, we’d be required to reach a Chi-Squared Factor of 3.841, which our example fell woefully short of. In line with these calculations, in order to obtain a 95% degree of certainty for the results in our example, we would have needed to extend the test until we obtained at the very least 6,830 visitors in total, distributed between both variations.
Our original test with its sample size of 2,045 visitors would’ve only held up 85% of the time. Now, that may seem pretty darn high, but you must take into consideration the fact that we used pretty small values in our examples. In a real case scenario, the breach would likely have been much larger.
If you’ve stuck with us so far, you might feel a little overwhelmed due to the sheer number of calculations required in order to determine statistical significance. Thankfully, there are plenty of online tools that can do the lifting for you, such as the HubSpot A/B Test Calculator or Dr. Pete’s Split Test Calculator & Decision Tool.
Conclusion
While split testing is a powerful tool, it can sometimes guide you in the wrong direction if your tests aren’t properly calibrated. However, armed with the new Divi Leads statistic reports, and now knowing how to spot when a result can’t be trusted, you’re fully ready to start A/B testing in style.
Just remember the following key A/B testing factors:
- Make sure your sample sizes are large enough. The more variants you choose to introduce into a test, the more traffic you’ll need.
- Don’t rush your tests! Although your mileage may vary here depending on how much traffic your site gets.
- Use the Chi-Squared test to determine whether your results are statistically significant.
Has A/B testing ever helped you significantly increase your conversion rates? If so, what sort of changes did you make? Share your experience with us and subscribe to the comments section below!
Article thumbnail image by vladwel / shutterstock.com


Great post, thanks for sharing!
No problem William – thanks for the kind words!
Very interesting article. Although Divi leads is a new module, it would already make a great enhancement when the result reports include a simple yes/no to the question if the test is already Statistically Significant. Maybe with some estimates as to how many visitors/days are expected to go by before that level will be reached.
Thanks for the kind words, John-Pierre. It’s certainly is an exciting addition!
Hi Tom,
This is a very comprehensive entry and I must confess that it aroused my interest in Divi.
Personally, I’ve split tested basically when I sent out email campaigns…however, from all indications, I would soon join the ‘Divi club’.
Do make the day great!
Always,
Akaahan Terungwa
Thank you for your comments, Akaahan!
Great read.
Thanks Richard!