
If you read a lot of blogs, you’ve probably come across an infographic at least once in your life. They’re those long-form images chock full of interesting facts and statistics. And infographics aren’t just fun to look at…they’re also a great marketing tactic for your website.
But if you’re not a designer, you probably have no idea how to create one. You need to know all kinds of fancy design principles, right? Nope. Thanks to a tool called Piktochart, it’s now possible for absolutely anyone to create an infographic. And in this post, I’ll show you exactly how you can use Piktochart to create your very own infographic.
Why You Should Create Infographics
Several years ago was the absolute golden age for infographics. Infographics went viral like crazy and were a great way to boost traffic and backlink numbers. And while the infographic craze has slowed, they’re still an immensely beneficial marketing tactic. Here’s why:
- Humans process images much more quickly than text. The oft-cited stat for how much faster is 60,000x. BUT I’ve never been able to track down a source beyond a vague 3M brochure, so I won’t pretend to tell you that’s 100% true. But even if it’s only twice as fast, that’s still a major difference.
- Infographics get linked to like crazy. With proper outreach, you can get your infographic shared on other relevant blogs. Each share means a juicy new backlink for you.
- Infographics go wild on visual social media. Pinterest, Facebook…all love a good infographic.
So between making it easier for your own readers to comprehend data and getting more backlinks and social shares, it’s still worth it to create infographics.
How to Create Infographics With Piktochart
For the purposes of this tutorial, I’ll use the free Piktochart account level. The free version gives you full access to the basic infographic builder. You’ll just miss out on:
- A 600+ template library
- The ability to remove the Piktochart watermark
- Higher quality downloads
If you’re a business, those features may well be worth the money. But for most individuals, the free account level is totally fine.
Basic Housekeeping
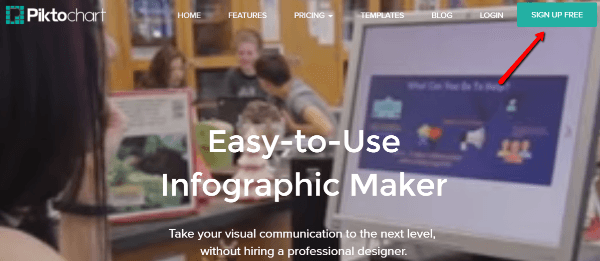
Get started by going to Piktochart and registering for an account:
Choose Your Visual Content
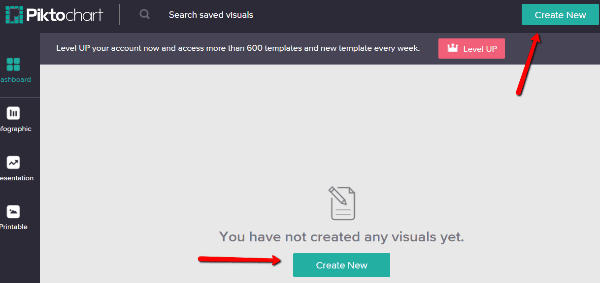
Once you register and confirm your email, you can jump straight into creating your first infographic:
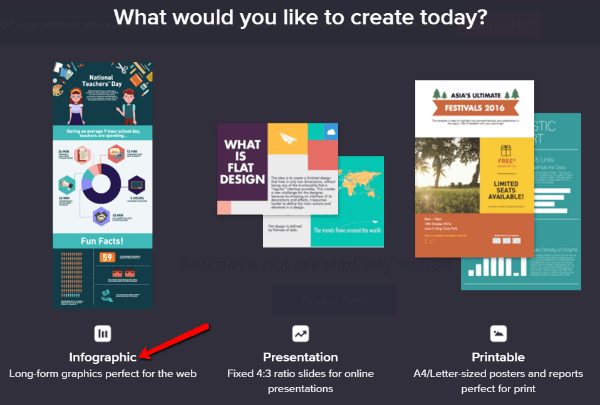
Next, choose what type of visual content you want to create. Piktochart lets you create:
- Infographics
- Presentations
- Printable posters/reports
For this guide, I’ll choose the infographic creator:
Pick a Template or Start from Scratch
Once you’ve selected your content, you can choose to start from one of Piktochart’s premade templates or use a 100% blank slate.
Unfortunately, the free account only comes with premade 10 templates, which is a far cry from the 600+ templates included with the paid plans.
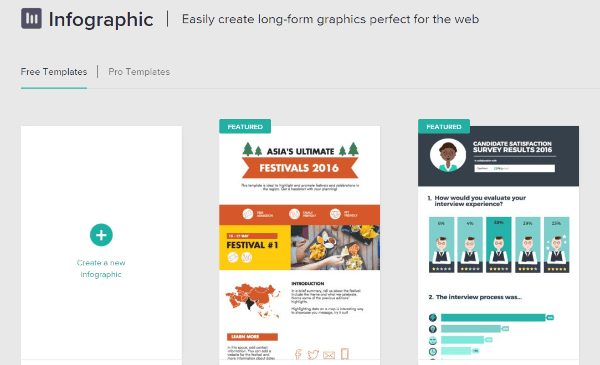
Despite the limited selection, it’s always easier to start with a template than it is to start from nothing. For this tutorial, I’ll first choose an existing template to show you how you can quickly edit it to fit your needs. Then, I’ll show you how you can add your own elements from scratch on a blank template.
Edit Existing Template Content
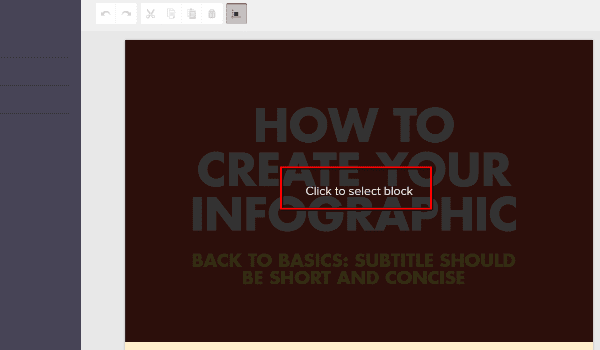
Because infographics are long-form content, Piktochart breaks your infographic up into different “content blocks”. You’ll edit each block one at a time. To start editing, just hover your mouse over the content you want to edit and click to select that block:
You can edit text by simply clicking and typing.
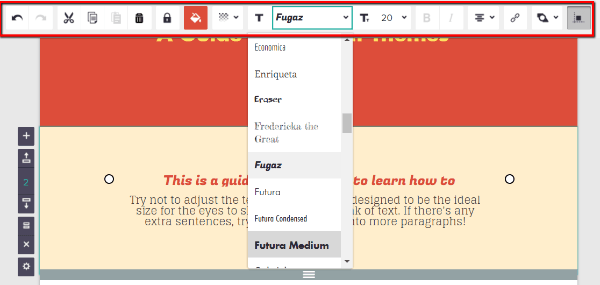
If you want to change fonts, font sizes, or colors, you can accomplish all that from the toolbar at the top of the editing area:
Add New Content
If you’re starting from a blank template, this is obviously a no-brainer – you’ll need to add new content to create your infographic.
But even if you go with one of the premade templates, you’ll still probably want to add some new elements to really make the template your own.
I’ll show you how to add new templates using a blank canvas. But the process is exactly the same for adding new elements to an existing template.
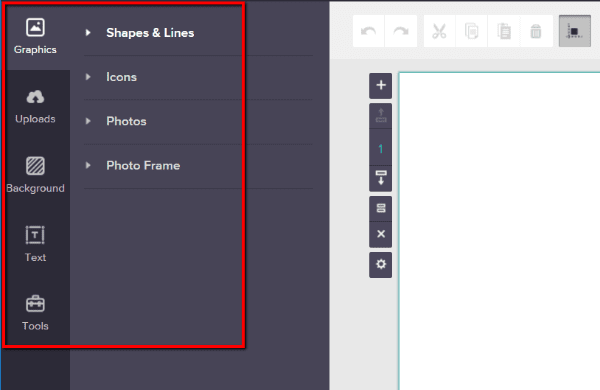
To add any new content, you’ll use the menu bar on the left side of your screen:
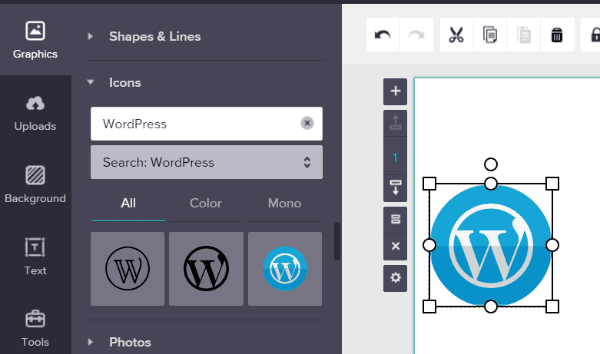
For example, to add a WordPress logo, you’d go to Graphics → Icons and search for WordPress. Then, you just need to drag the icon over to your infographic canvas:
You can follow a similar process to upload your own images or add text blocks.
Another nifty feature worth exploring is the Tools section. It lets you easily convert raw data into charts, which you can then add to your infographics.
Because so many infographics rely on statistics and charts, this is a super helpful feature.
You can add your data via an in-browser spreadsheet or import it from an existing spreadsheet if you’re working with an especially large data set:
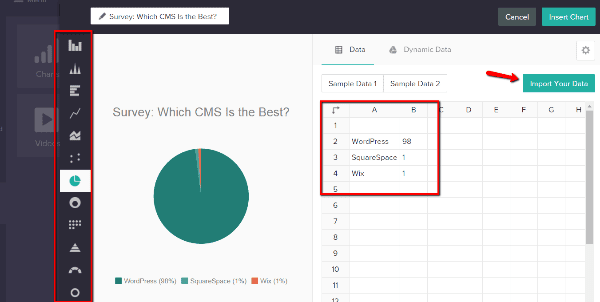
Then, you can choose from a variety of chart types on the left-hand side.
Whenever you’re finished, you just click the Insert Chart button and your chart will be added to your infographic. You can manipulate the size and positioning until you’re 100% happy.
Piktochart also comes with two other handy tools:
- Videos – quickly embed videos from YouTube or Vimeo. Obviously, this won’t work for printables. But it’s a handy way to create a multimedia digital infographic.
- Maps – display maps with custom data for each region. For example, on a map of the USA, you can customize data for each state.
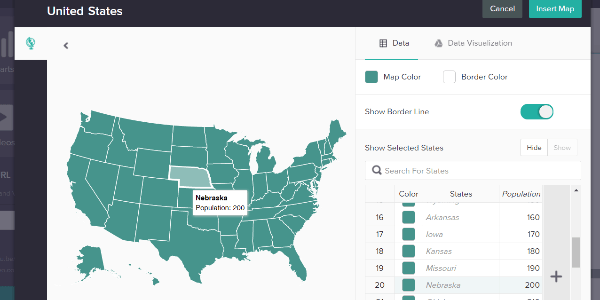
These tools are what really set Piktochart apart from Canva when it comes to infographics. You can showcase and manipulate your data in powerful ways with Piktochart.
Customize Your Backgrounds
The last important element for your infographic is its background.
In the Background tab of the sidebar, you first need to choose your base background color. Then, you can choose whether or not to overlay one of Piktochart’s background images on your solid color background:
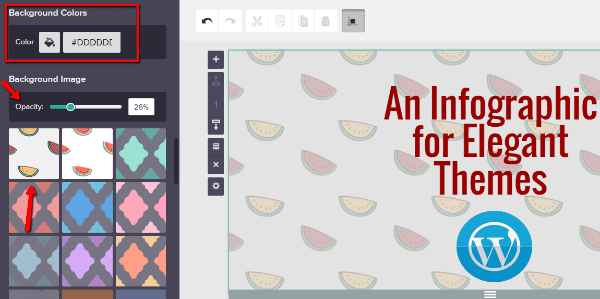
If you choose to use a background image, you can play around with its opacity to make sure it doesn’t overpower your other infographic elements. Lowering the opacity makes the image more “see through.”
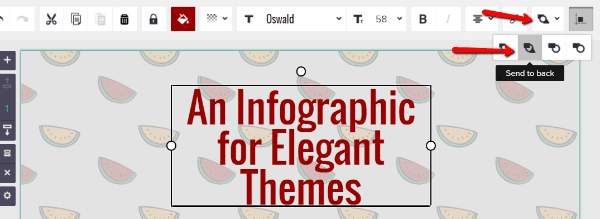
You can also upload your own images to use as a background in the Uploads tab. You just need to use the Arrange tool to Send to back so that they appear behind the other elements on your infographic.
Wrapping Things Up
As user-friendly as Piktochart is, it will still take you time to create a quality infographic. That’s not a knock on Piktochart – it’s just an unavoidable consequence of trying to create a data-packed, long-form graphic.
But I’ll tell you this…if you’re not a professional designer, using Piktochart is a lot easier than trying to create an infographic from scratch. And if you’re already familiar with online design tools like Canva, you should feel right at home with Piktochart.
Have you tried creating an infographic with Piktochart? What was your experience?
Looking for otherways to create and share unique, engaging content? Try out one of these table plugins for WordPress if you routinely create data-driven content to share with your website viewers.
Article thumbnail image by smartdesign91 / shutterstock.com


Canva slows down my computer and it’s not helpful when creating infographics. Piktochart looks like the perfect tool. I’m definitely going to give it a try.
Thank you so much Kevin
My Malwarebytes keeps blocking the “Free Sign Up” page because it’s malicious.
Thanks for such a great guide! I’m definitely going to give it a try!
This is a great guide, Brenda! Thanks so much for writing this and we appreciate you!
Although not as powerful, Canva is another online free alternative for text and images. It is very easy to learn and use and does not have a watermark.
Great intro to an interesting tool. Thanks.
How does this relate back to my DIVI-made site? I assume that the graphics are not dynamic and dependent on the data. Does the tool create a png that I save and can use as I like or is it a link back to the Piktochart site?
This has been really helpful. I’ve found Canva quite frustrating for infographics, and this beautiful and clear tutorial will allow me to expand my skill set. Thanks so very much!
great info!! thanks for sharing Brenda