
No matter what kind of website you run, you’re doing to be digging into data somehow. Most likely, that will either be through the Jetpack plugin and its built-in stats or through Google Analytics and its unbelievably detailed set of tracked metrics. When you sit down to really parse those numbers, you’re getting into data analytics at varying levels. But just what is data analytics? And what can you do with it? Well, that’s what we’re here to tell you.
What is Data Analytics?
When put as simply as possible, data analytics is the process of looking at raw data, figuring out what it means, and then applying that knowledge to solve problems. It’s kind of a subsection of the larger data science field, and truly one of the more ubiquitous ones. Because everyone with a website deals with raw data in some way.
For example, let’s say you’re using Google Site Kit. When you click into the dashboard, you will see a set of data like this.
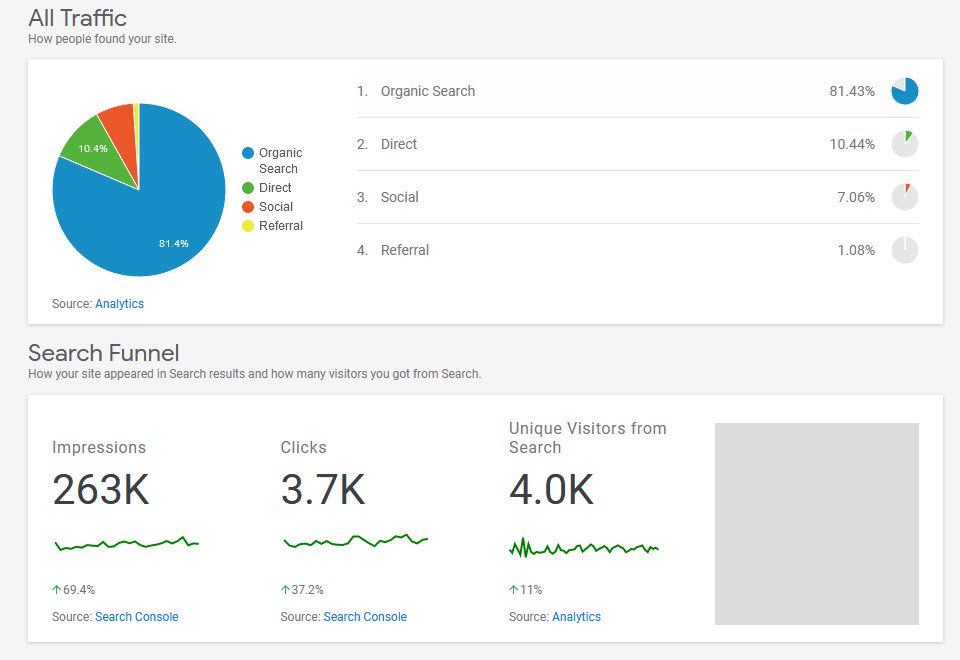
Data analytics comes in because all of this is raw information that you see and can read. But the interpretation is what matters. Knowing that you have had a 37.2% increase in clicks over the past month is great. But…what do you do with that?
That’s where data analytics becomes a part of your web presence. What you have is data. Data on users and their behaviors, to be precise. Data science is the umbrella term you use when saying you’re going to be working with this data in some way. Data analytics is the way that you do it and what you do with it afterward, more specifically looking at granular data than large trends.
You might use an algorithm to sort and clean up the data to exclude outliers and extremes or duplicates. Even something as simple as seeing the increase in clicks, going to check your highest performing pages or posts, and then making a plan to create cornerstone content on those topics is within the realm of data analytics.
The Four Kinds of Data Analytics
Whenever you see the term data analytics, you will also most likely see it broken down into four specific areas.
- Descriptive analytics
- Diagnostic analytics
- Prescriptive analytics
- Predictive analytics
No matter what you’re working with, the data and way you process it will fall into one of these categories.
Descriptive analytics
This is what would be used above when talking about website stats. Descriptive analytics covers what happens over time. Things increasing or decreasing — time spent on the platform, clicks, which platforms refer to your site the most often, etc. You may not get the reasoning behind why the user is acting a certain way, but you can pinpoint exactly what they’re doing.
Diagnostic analysis
When you’re looking for the reason why something is happening, you’re using diagnostic analytics. If your website stats are booming and you want to know why (so that you can keep doing it), you will be looking at all the information from the website. You know clicks are up. But what particular articles are being seen? Are there times of day that get more traffic? You will dig in and determine the demographics of the visitors and whether or not any email campaigns have been sent that correlate to the spike. By taking a holistic look at the data, you can determine within a reasonable margin of error, the most likely factors that caused the data to look the way it does. And by diagnosing why it happened, you can then attempt to replicate it. (Or, if something has gone wrong, avoid making those same choices.)
Prescriptive analysis
Prescriptive analytics is when you’re taking a look at the data and determining a reaction to it. Such as, if the number of clicks on Nintendo Switch articles increases another 25% for the next few months, you would then plan to up the output of articles on that topic and maybe even begin the process of hiring more writers to cover the increase. You are making plans based entirely on data you have and know has lasted over a period of time.
Predictive analysis
Now this on the other hand, is the practice of looking at a set of past data and making an assumptive plan based off it. This differs from prescriptive because there’s no way to know if your plan is 100% going to work out. For example, if you had 70% of all citizens indicate on a survey that they want a farmer’s market in your town and you make a plan to open up a weekly market…that’s making a predictive plan based on data. You are making an educated guess based on data, predicting the city’s residents will respond positively to your business, but you have no farmer’s market data of your own to go on.
Where to Start with Data Analytics
So that’s the basic outline of what data analytics is. But where do you go now?
First, you will want to install Google Analytics on your site. It’s very easy, and it’s just a couple of clicks. Once you’ve done that, you can start in with some of our tutorials, such as landing page tracking and tracking user engagement. You can even set up your own analytics dashboard to integrate the platform.
If you’re not the Google type, they’re not the only game in town — even if they are the biggest. Let us show you some of the other options you have that aren’t the Big G.
And there are all sorts of different kinds of data that you can track and dig into. You might want to get heatmap data so you understand how your users interact with your site. Perhaps you want to bring in your social media presence.
We’d also like to recommend the tool Databox. Basically, it takes all your various and sundry data analytics tools and puts them in one place. While you still have to work with the data analytics yourself, having all the KPIs in one spot is incredible.
Wrapping Up
No matter where you are with data analytics, a beginner or a seasoned veteran, it’s a good idea to go over the basics. Because if you’re just looking at data, you’re not taking action. You just have data. It’s how you look at that data and move forward with it that matters. Whether you diagnose a problem or predict a response to your users, making the best decisions you can begins and ends with data analytics.
What do you use data analytics for in your business?
Article featured image by Julia Tim / shutterstock.com


I use the data for a variety of things. To track organic traffic, it’s the source, and then click through rates. I also track the demographics so that I know who my audience is. I also agree than GA is step 1 for any website:) Nikki
I think Google Analytics should be installed from day 1 when a website is online. It is practically impossible to know your audience without having access to data.