
Understandably, navigating endless tables and lists of numbers can get boring pretty quickly. If you’re showing data on your website, you need to make the presentation as engaging as possible so readers don’t miss out on critical information. That’s where using a WordPress chart plugin can help.
In this article, we’ll introduce you to the best WordPress chart plugins on the market. We’ll explore their features, what types of visualizations they enable you to create, pricing, and more. Let’s talk data!
Subscribe To Our Youtube Channel
1. Visualizer

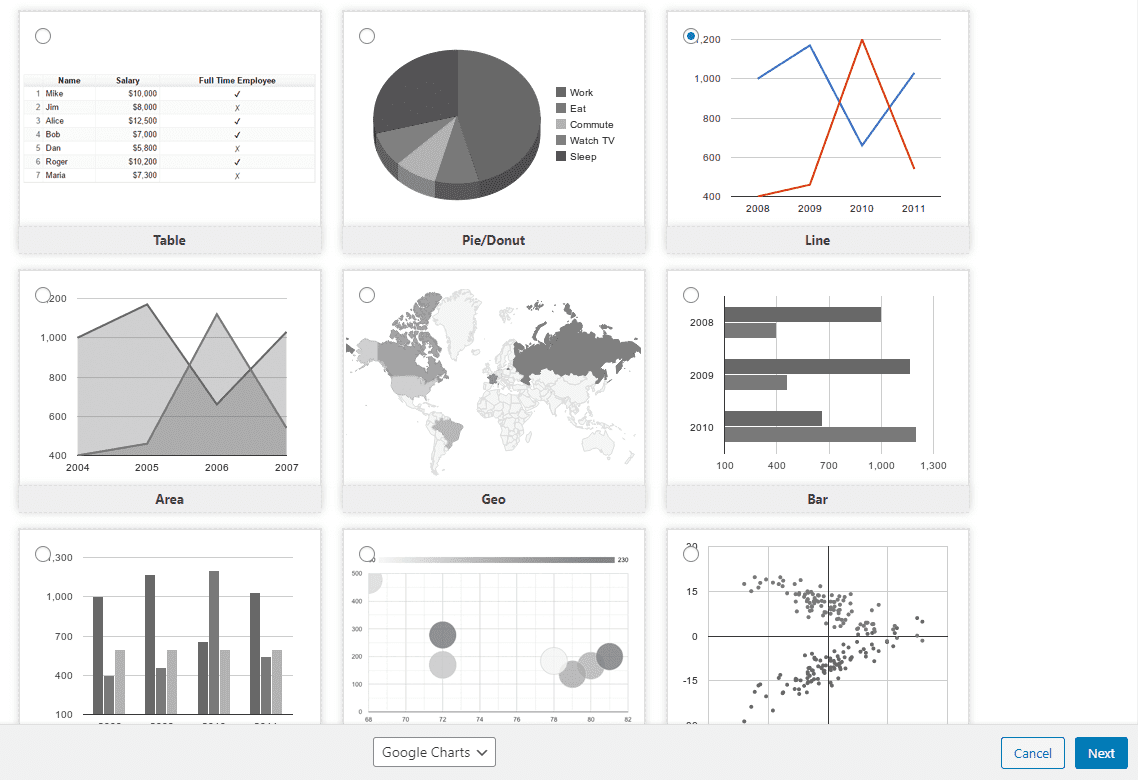
Visualizer: Tables and Charts Manager is a plugin that enables you to create data visualizations from templates by adding data manually or by importing it from third-party sources. It includes nine chart types, including:
- Line charts
- Area charts
- Bar charts
- Column charts
- Pie charts
- Geo charts
- Table charts
- Bubble charts
- Scatter charts
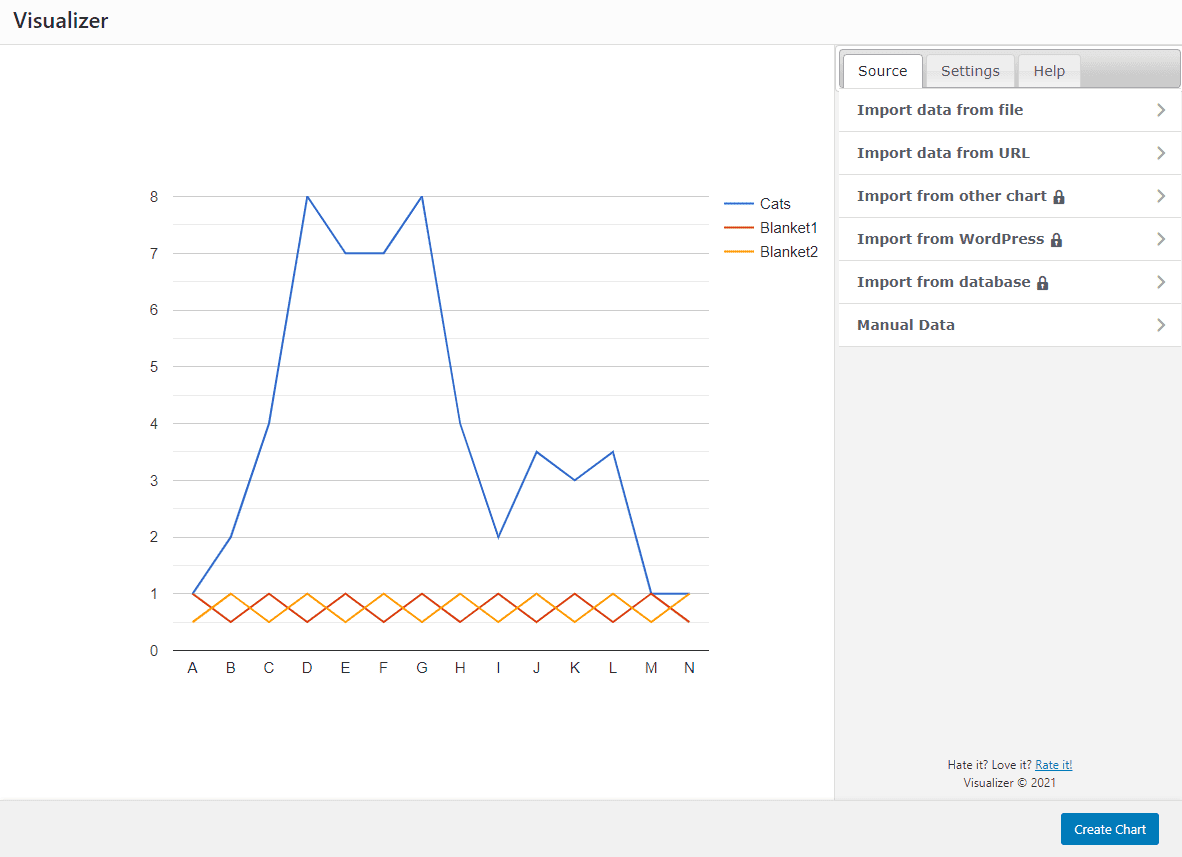
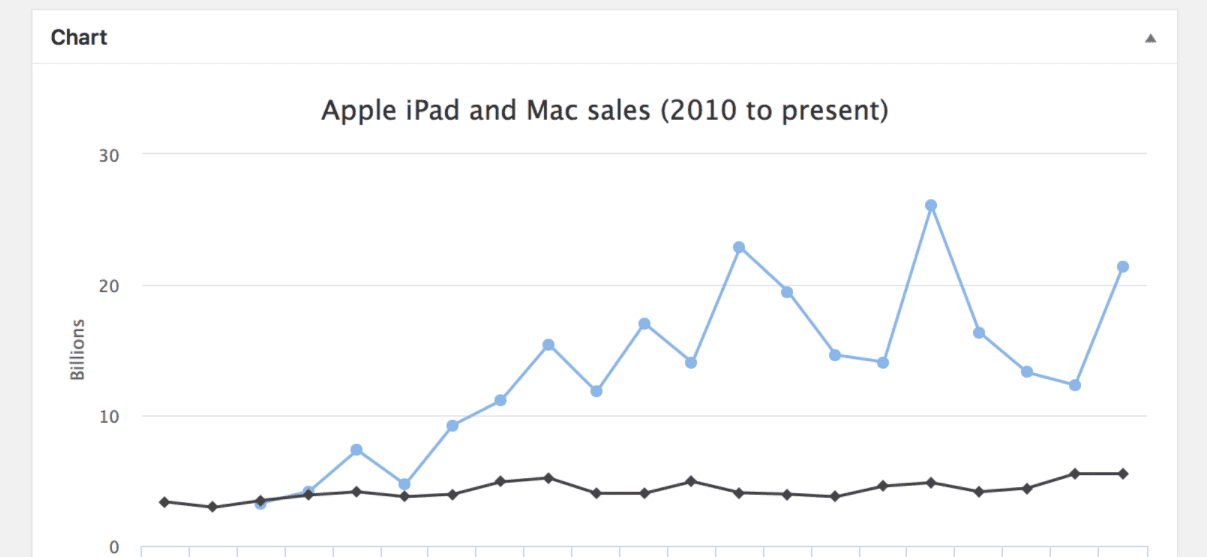
Visualizer uses HTML5 and Scalable Vector Graphics (SVG) to generate responsive charts:
With the free version of the plugin, you can import data from URLs or input it manually. If you use the premium version of Visualizer, you also get the option to import data from other charts, WordPress installations, and databases:
The plugin enables you to modify each aspect of your charts and tables, including their axes, colors, line-width, and placement. Moreover, you can enable users to print or download charts in multiple formats:
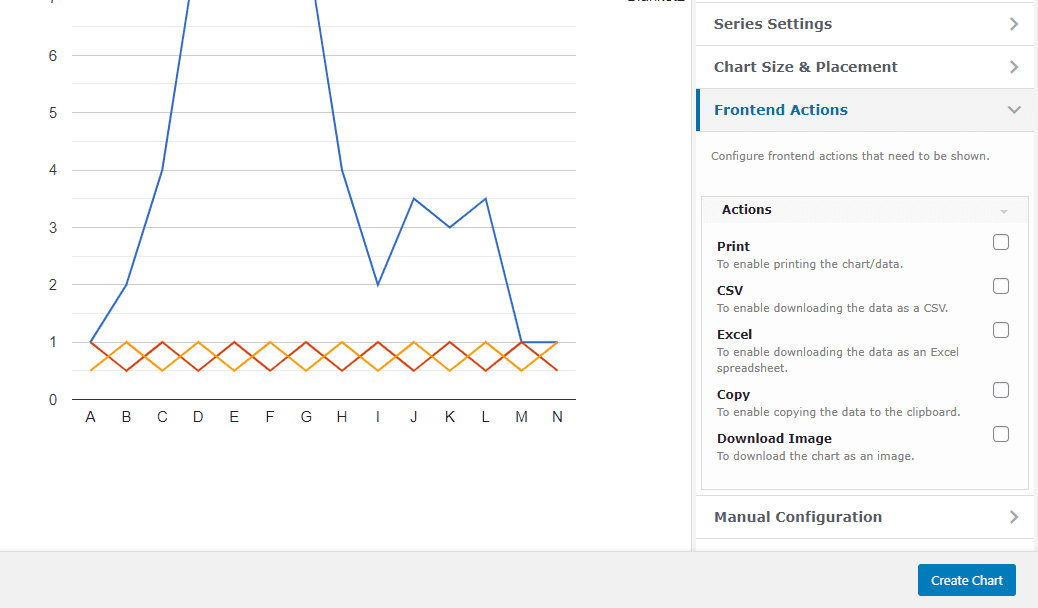
Finally, you can add charts to your pages using either the Block or Classic editors, which makes this plugin highly versatile.
All of the features we’ve talked about so far are available in the free version of Visualizer. If you purchase a premium license, you’ll get access to custom spreadsheet and front-end editors, additional data import options, private charts, additional chart types, and more.
One of the most interesting features that Visualizer premium offers is the option to sync tables with online files. That means you can make changes to a spreadsheet and have its corresponding table or chart on your site update automatically.
Key Features:
- Create nine types of charts and tables
- Generate responsive charts and tables using HTML5 and SVG
- Import data from multiple sources
- Customize the style and behavior of each element
- Enable users to print and download data visualizations
Price: Free with a premium version that starts at $59 per year | More Information
2. Data Tables Generator

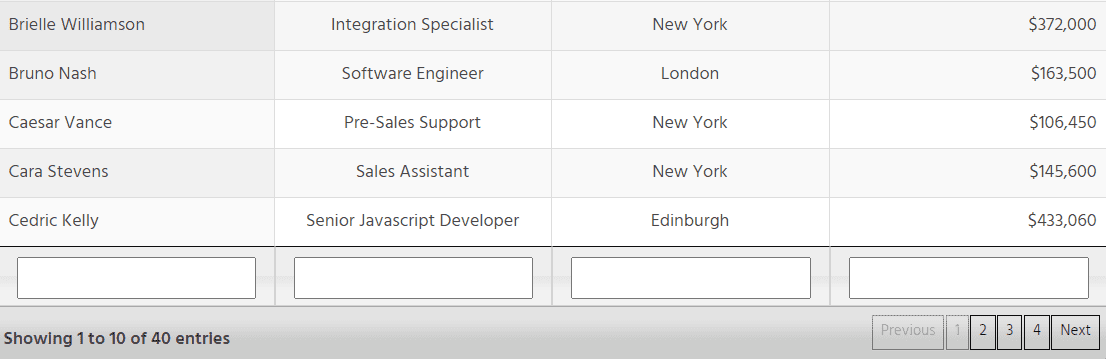
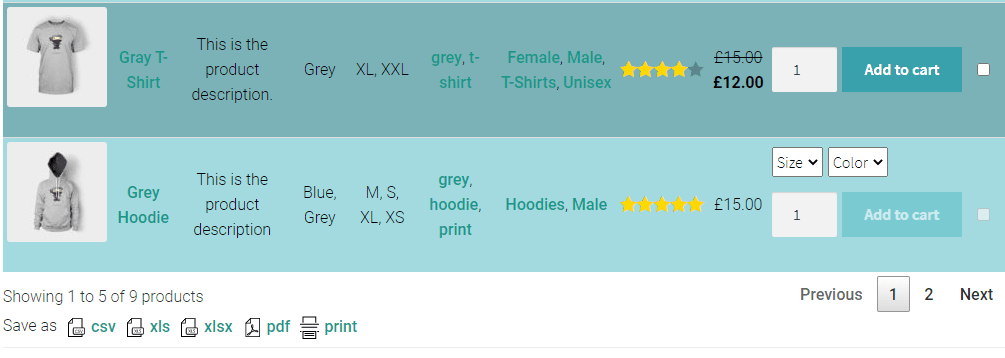
Data Tables Generator by Supsystic is a fantastic WordPress chart plugin that enables you to create responsive tables and charts. Displays enable viewers to search, filter, and sort table contents.
This makes Data Tables Generator ideal if you need to share massive amounts of data. To make navigation easier, it enables you to paginate table elements:
Additionally, Data Tables Generator is an effective solution for product and user lists. You can even integrate it with WooCommerce and include add-to-cart buttons to create order forms:
The free version is limited to tables. However, with a premium license, you’ll be able to generate:
- Area charts
- Line charts
- Pie charts (2D and 3D options)
- Bar charts (2D and 3D options)
- Column charts
- Bubble charts
- 3D pyramid charts
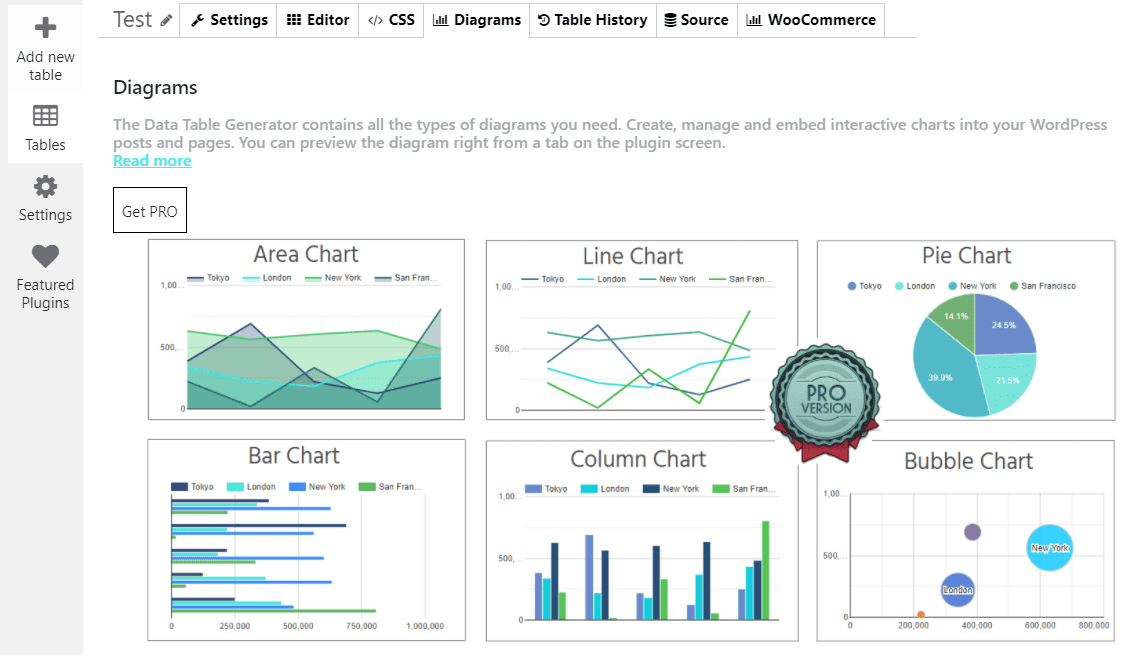
Here’s a quick look at Data Tables Generator’s diagram selection:
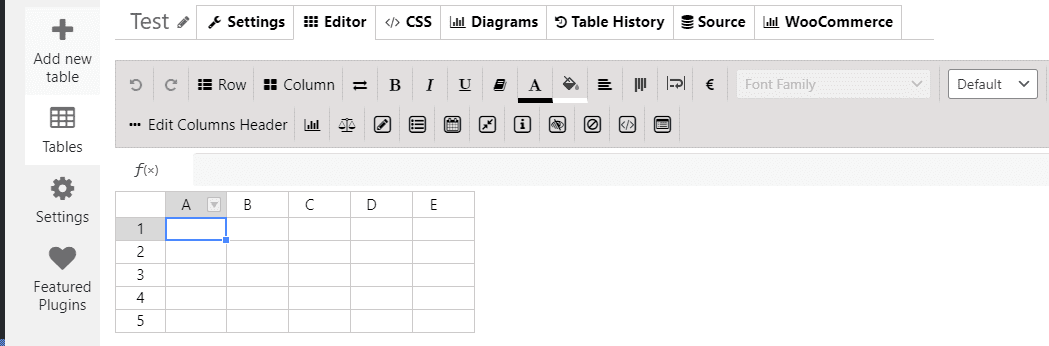
With the free version of the plugin, you also get access to a built-in spreadsheet editor, as well as the option to add custom CSS:
To add charts to your posts and pages, Data Tables Generator generates a unique shortcode for each element, which works with both the Classic and Block editors. As far as importing data goes, you’ll need a premium license to use the plugin with Google Sheets, Excel, CSV, or PDF files.
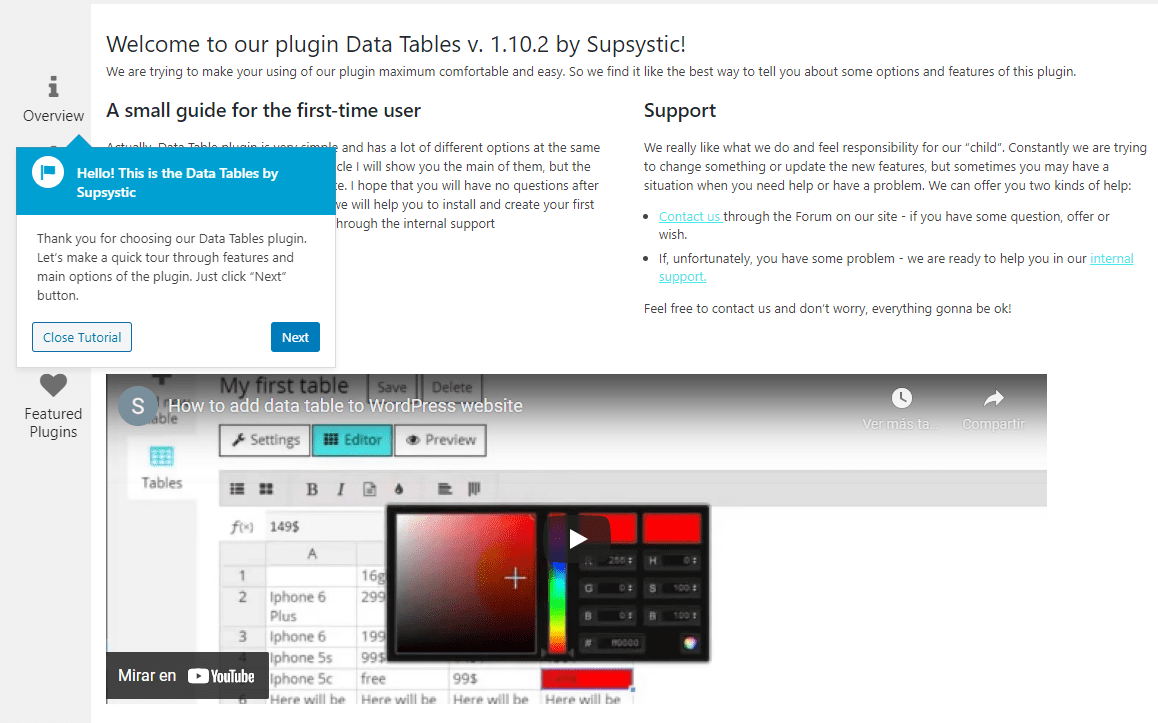
Finally, it’s worth noting that Data Tables Generator provides comprehensive user tutorials:
If you’re planning to use mostly tables for data visualization, the free version of Data Tables Generator is a solid pick.
Key Features:
- Generate interactive tables using a built-in spreadsheet editor
- Enable users to search, filter, and sort tables
- Add CSS or use built-in styling options
- Integrate with WooCommerce to create product list tables
Price: Free with premium licenses starting at $46 per year | More Information
3. amCharts: Charts and Maps

amCharts: Charts and Maps is perhaps the most powerful WordPress chart plugin and data visualization tool that you can use. More importantly, it’s a fully free plugin – with a caveat.
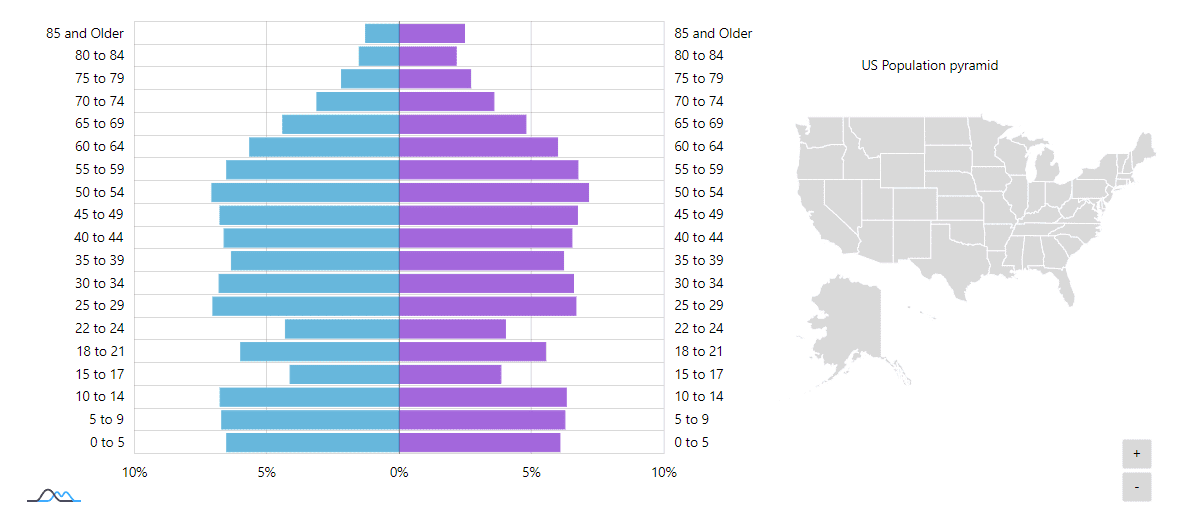
Although the plugin is free, it’s meant to work alongside the amCharts software. This platform also offers a free license, but only if you don’t mind it including a small amCharts attribution, which is the icon that you can see at the bottom of this chart to the left:
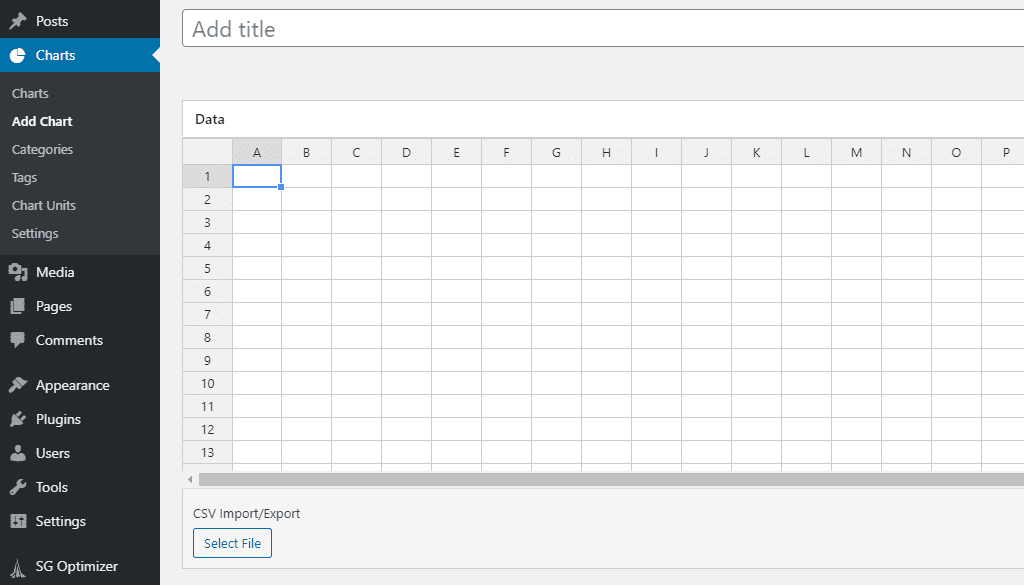
The reason why you need to use the amCharts software is that the plugin doesn’t include a chart builder. Instead, it simply asks you to add the HTML and JavaScript for your chart when you create a new element:

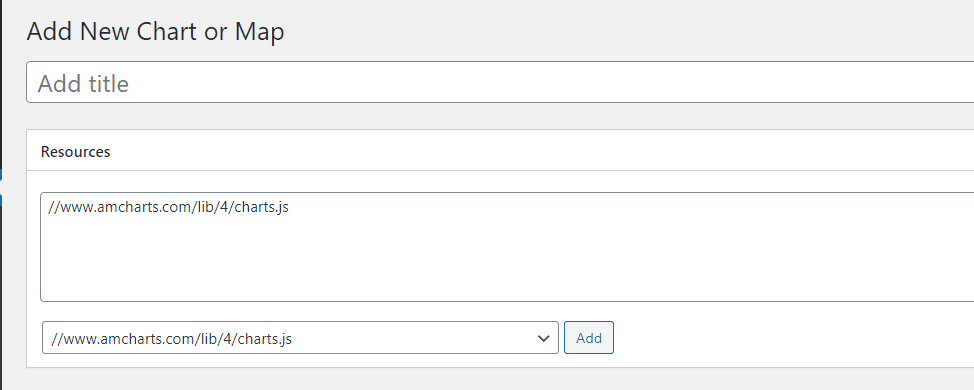
Since amCharts data displays often require external libraries to function, the plugin enables you to select which of those resources you want to import for each chart that you create:
If all that you need is to create simple, straight-to-the-point charts or diagrams, amCharts can be overkill. Where the software shines is when it comes to complex, interactive data visualizations:
Using amCharts, you’ll be able to present data to your visitors in ways that simple, static tables just can’t match. What the plugin does, in a nutshell, is help you import those charts and display them on your WordPress website without having to mess around with external libraries or add code to your pages manually.
Key Features:
- Add amCharts content to WordPress without needing to edit files manually
- Import specific amCharts libraries for each element that you add to your website
- Use shortcodes to place charts wherever you want on your website
Price: Free | More Information
4. M Chart

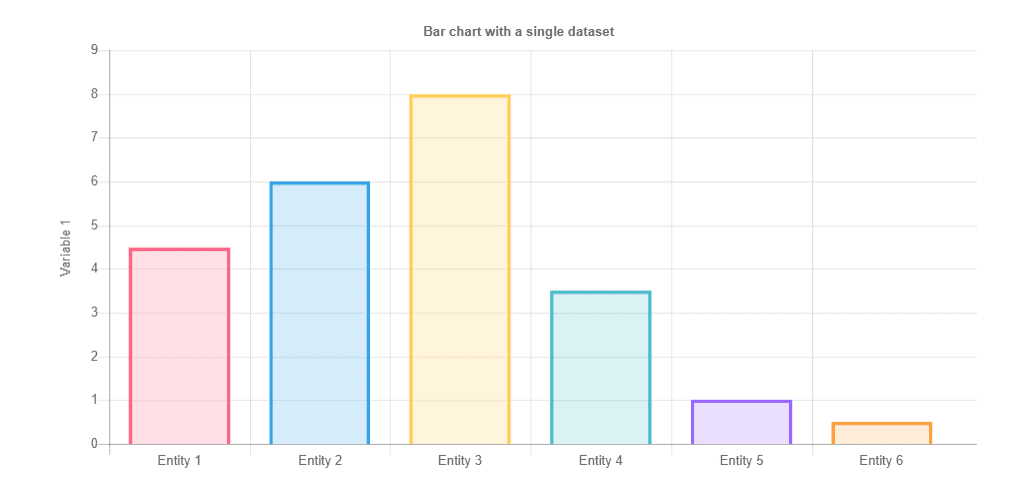
M Chart is a free plugin that enables you to create charts for your WordPress website using a built-in spreadsheet editor:
If you’ve ever generated a chart from a spreadsheet, using M Chart should be fairly straightforward for you. However, one aspect that’s lacking is that the plugin doesn’t include styling options for your charts:
With that in mind, it’s important to note that you’re free to add CSS to your charts if you’re comfortable doing so. Putting that aside, M Chart is possibly the most straightforward WordPress data visualization plugin that you can use on your website. With it, you can generate the following types of charts:
- Line charts
- Bar charts
- Pie charts
- Column charts
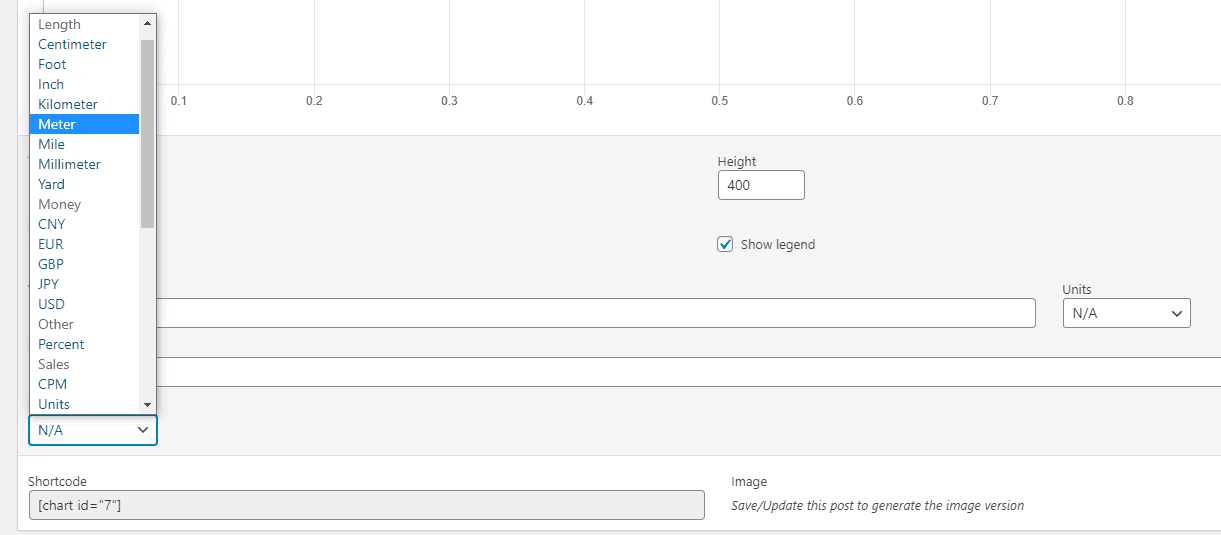
Another thing to keep in mind is that this plugin enables you to choose from several pre-coded Units of calculation for your charts. If the units that you want to showcase aren’t included, we’d recommend a different plugin:
Once your chart is ready, the plugin will save it on its own page and you can enable comments for it. If you want to add charts as part of other pages, M Charts also generates a unique shortcode for each element that you create.
Key Features:
- Create charts using a built-in spreadsheet editor
- Choose from pre-coded units of calculation for your data
- Use shortcodes to add charts to your posts and pages
Price: Free | More Information
5. UberChart

UberChart is the sole premium-only WordPress chart plugin on this list and for good reason. This is the WordPress data visualization plugin that offers the most customization and data import options for creating and adding charts to your website, and it comes at $39 per license.
Using UberChart, you can create and customize ten different types of charts, including:
- Line charts
- Area charts
- Bar charts
- Horizontal bar charts
- Pie charts
- Doughnut charts
- Radar charts
- Polar area charts
- Scatter charts
- Bubble charts
Moreover, it includes over 200 customization options for each chart. That might sound a bit like overkill. However, having the ability to customize every single aspect of the visualizations that you create is definitely a plus.
UberCharts supports all major spreadsheet formats, which enables you to import data from almost any source you want. For backup purposes, the plugin can also help you export data and charts in XML format, which lets you copy elements from one site to another.
If you want to input data from scratch, you can do using UberCharts’ built-in spreadsheet editor. The plugin also offers dozens of pre-built chart models that enable you to take data and generate visuals that require little to no customization before they’re ready for the public.
Key Features:
- Create up to ten different types of charts
- Use a built-in spreadsheet editor to input data manually
- Import data from all major spreadsheet software options
- Back up charts as XML files that you can import on other websites
- Use pre-built chart models to generate data visualizations quickly
Price: A one-year license costs $39 | More Information
Conclusion
Using a WordPress chart plugin is a fantastic way to take large datasets and transform them into engaging visualizations that your users will enjoy seeing. The easier you make the data to understand, the easier it becomes to get your points across.
As far as the best WordPress chart plugins go, here are our five picks:
- Visualizer: A user-friendly chart plugin with a great selection of chart types for its free version.
- Data Tables Generator: This should be your go-to choice if you want to focus on tables over charts.
- amCharts: If you’re a fan of the amCharts charts software, this plugin will let you import your creations into WordPress.
- M Chart: This plugin is a straightforward solution for creating simple WordPress charts.
- UberChart: A premium plugin that includes a broad selection of chart types and customization options.
Do you have any questions about which WordPress chart plugin to use? Let’s talk about them in the comments section below!
Featured image via MisterEmil / shutterstock.com


Any plugin that supports, multiple y axis line charts?
Great list Will! Comprehensive, yet focused on solid choices. I know there are other chart plugins out there, not on this list – and rightfully so 🙂
Thanks for the kind words, Oliver!
How about a plug-in (or website for that matter) that renders sensitivity charts. Sensitivity charts are such a powerful way to analyze data, but I haven’t found anything that renders them.
Hi Kenneth! I’m not aware of any plugins that include sensitivity chart templates. However, you might be able to use one of the more customizable plugins on this list to create your own. amCharts is particularly flexible, so you may consider starting there. It has a ‘stacked bar chart with negative values’ demo you could try. There’s also a ‘floating bar chart’ demo that may be suitable.