
Good businesses and organizations make data-backed decisions and design products or provide services that are likewise measurably beneficial. But just because data is useful doesn’t mean it’s always easy to understand. In fact it can often be just the opposite. That’s where data visualization comes in. By displaying information in helpful charts, graphs, number counters, and other forms of data visualization we make that information more understandable.
As a WordPress user, you have many options for data visualization. So many, that we can’t even talk about them all here today. But what follows is a solid list of the best tools currently available that are compatible with WordPress and do a great job of taking numbers and turning them into visual representations that your prospects, clients, and customers can use and enjoy.
Best Tools for Data Visualization in WordPress
Here’s a good sampling of the best data visualization currently available for WordPress.
Data Tables Generator by Supsystic
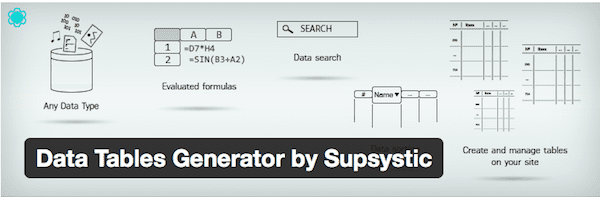
If you want an easy way to create and modify tables from the WordPress dashboard, Data Tables Generator might be a good option for you. Tables are responsive and you can create all sorts of interactive charts and graphs for visitor enjoyment.
Features:
- Support for formulas and data cells
- Captions, headers, and footers
- Frontend editing, no coding required
- Color options
- Multiple styles
- SEO support
- Pagination, filtering, and sorting
- Google Charts integration
Price: Free | More Information
WordPress Charts
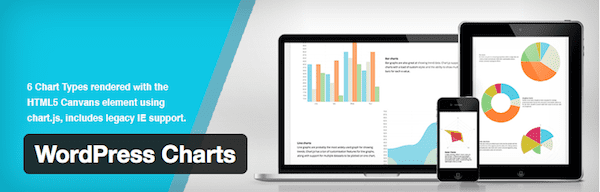
With the WordPress Charts plugin, you can easily add HTML5 charts to your WordPress site with no fuss. It promises to be lightweight and comes with six different chart types including line, bar, polar area, radar, pie, and doughnut, so you can present data in the way that makes the most sense for your site.
Features:
- Supported by all modern browsers
- Multiple customization options
- Easy to setup
- Retina display support
- WP Charts Widget included
Price: Free | More Information
wpDataTables

Here’s another full-featured table plugin that allows you to display data in a multitude of ways. wpDataTables is responsive and works with most major WordPress themes, including Divi. In fact, wpDataTables comes with unique integrations built just for Divi!
Features:
- Import and export support for Excel, CSV, and Google Spreadsheets
- 35 different chart types
- MySQL query support
- Live filters
- Conditional formatting
Price:$35 | More Information
M Chart
M Chart makes it easy to add and manage data in a standard-looking spreadsheet interface in the WordPress dashboard. It relies on the Highcharts chart library and you can embed your completed charts using a shortcode.
Features:
- Easy-to-use interface
- Lightweight
- Shortcode support
Price: Free | More Information
POWr Graph

The POWr Graph plugin is still another way to add graphical data to your website. It’s a cloud-based plugin that lets you edit charts directly on live web pages. Once the plugin is installed in WordPress, you can add new charts or graphs wherever you’d like.
Features:
- Support for multiple chart types.
- 10×10 data fields
- Customizable styles
- Interactive controls
- No watermarks (premium version).
- Plugin analytics (premium version).
- Unlimited data set sizes (premium version).
Price: Free and premium plans starting at $3.19/month | More Information
DrawIt

Another plugin that adds powerful data visualization to your site is DrawIt. This plugin lets you create drawings, diagrams, and flowcharts right within posts. The images are saved as PNG or SVG files, which means you can update them whenever you’d like.
Features:
- Add new diagrams via the Media Library, visual editor, or text editor
- Connects to draw.io website for a familiar and reliable interface
- PNG and SVG support
- Easy to use
Price: Free | More Information
Snowball
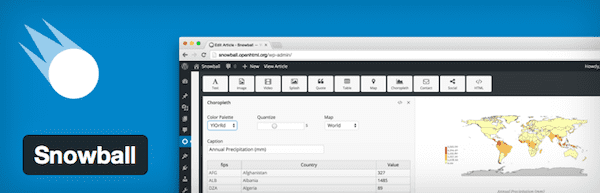
This plugin is designed to make it easier for journalists and bloggers to create high-quality articles with plenty of embedded charts, graphs, and data. With Snowball, you can create articles using different content blocks, so the resulting content is structured like a magazine piece.
Features:
- Set content and styles for each content block.
- Use code editor to modify HTML and CSS if you wish.
- Basic modules include text, tables, columns, HTML, sidenote, splash, and pullquotes.
- Social modules include Twitter and Vine.
- Media modules include images, YouTube, Vimeo, Google Maps, SoundCloud, and image comparison sliders.
- Data modules include scatterplot, bar graph, and choropleth.
- Meta modules include contact forms, share buttons, and a table of contents.
Price: Free | More Information
PressStats

Add statistics and data to WordPress with just a few clicks using the PressStats plugin. It’s touted as a plug and play solution with no configuration required, which might make it worth dipping into your budget for.
Features:
- Geolocalization support
- Cache support
- Widgets
- Widget and dashboard widget support
- Interactive graphs
Price: $15 | More Information
Responsive Charts
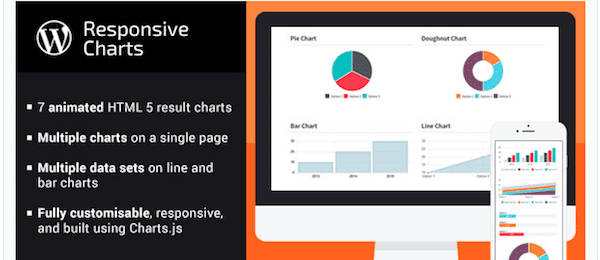
Responsive Charts is another great way to add HTML5 animated charts to your WordPress posts and pages. It’s another premium option but the reasonable price tag might make it worth it to you.
Features:
- Fully responsive
- Insert multiple charts on one page.
- Customizable charts and tooltips
- Import CSV data sets
- Support for 7 animated chart types including pie, bar, line, polar, radar, doughnut, and Bootstrap progress bars.
Price: $15 | More Infromation
TablePress

TablePress is a versatile plugin that makes creating stylish tables that can be embedded in WordPress a snap. You can add tables to posts, pages, or even in text widgets using a shortcode.
Features:
- Spreadsheet editing
- Formula support
- JavaScript library support that adds filtering, pagination, and sorting for the frontend.
- Import/export support for Excel, HTML, CSV, and JSON files.
Price: Free and premium extensions that average about $9 | More Information
WordPress Charts and Graphs Lite

Here’s another great way to add interactive charts to WordPress. This plugin actually uses the Google Visualization API, which makes for excellent cross-browser compatibility as well as mobile support.
Features:
- Support for 9 chart types in the free version and 12 in premium.
- Fully customizable
- Live editor
- Import data from other charts
- Support and updates available with premium plan.
Price: Free. Premium versions available starting at $74.99/year | More Information
Infogram

You can add charts and infographics to WordPress using the Infogram plugin. This free offering allows you to create responsive and interactive charts and graphs that look great on multiple browsers and devices.
Features:
- Template designs
- Responsive
- Pre-set colors
- Resulting visualizations are easy to embed
Price: Free | More Information
TransitArt

TransitArt is a really unique plugin that lets you integrate public transportation timetables and information into your website with ease. With it, you can present data in the form of timetables or as a trip planner. The plugin itself is a demo that comes with demo data for several major cities.
Features:
- Set routes and schedules (premium)
- Create a trip planner (premium)
- Include vehicle position (premium)
- Mobile app support (premium)
Price: Free Demo with premium plans starting at $79/month | More Information
Blazing Charts

The last plugin on our list is Blazing Charts. It’s straightforward and simple but definitely gets the job done by making use of existing charting libraries with a GPL license.
Features:
- Easy to use
- Supports many charting libraries including ZingChart, Chart.js, Google Charts, Smoothie Charts, Flot Charts, D3.js, Morris.js, Chartist.js, and HighCharts.
Price:Free | More Information
Wrapping Up
Representing data in a graphical manner is a basic part of doing business. So this would naturally translate to the online space as well. That doesn’t mean you have to reinvent the wheel, however. With the above tools, you now have plenty of options for using WordPress data visualization as an integral part of site design.
Have you used any of the tools on this list for WordPress data visualization? Which was your favorite? I’d love to hear your thoughts below
Article thumbnail image by Abert / shutterstock.com


Very helpful information for data nerds like me. I’ll check out some of these suggestions. Right now I’m using screenshots for simple charts and Tableau Public for complicated charts or those that need some interactivity (e.g., to figure out which curve belongs to which data set).
Tableau Public is free (there is also a pricey version for professionals). It had a bit of a learning curve for me, but it wasn’t too bad. It’s also challenging to embed the image into WordPress, requiring an iFrame hack on my blog (perhaps Tableau will fix their embed scripts someday…).
One of Tableau Public’s interesting features is the “story,” which stacks multiple charts into one container and allows the user to move from one to the other. I’ve done some interesting things, including a story about worldwide production and consumption of millet.
These are great! I was checking out wpDataTables and I saw that they offer a free lite version as well. https://wordpress.org/plugins/wpdatatables/
Good looking out, Sharon!
Wow Brenda!
This is an extremely valuable article. So many helpful tools on here, and it’s surprising to see how many of them are free!
I must ask… do you know of any data visualization tools for WordPress that deal with maps?
I know Infogram offer maps in their app, not sure on plugin though, so they may be a good place to start.
I second the Infogram suggestion!