
If you’re a content creator or a writer, you must hold one rule above all others: show, don’t tell. You can explain something in 1,000 words and still not get the information across as well as an image or visualization of the concept could. That’s why the Visualizer plugin by ThemeIsle stands out as one of the best WordPress chart plugins. Even the free version we’re going to talk about can enhance any post or page that contains data. With interactive tables, charts, and graphs that even non-data scientists can use and create this plugin can help your audience see exactly what you need them to.
Subscribe To Our Youtube Channel
Visualizer Tables and Charts
There are two versions of Visualizer. The first is the free version on the WordPress repository. You can download and install it and get to work without any trouble. ThemeIsle also offers a Pro version that unlocks various features for a $59 per year licensing fee. For most people, we feel the free version is just fine, but having a Pro version is never a bad thing (for users or the business).
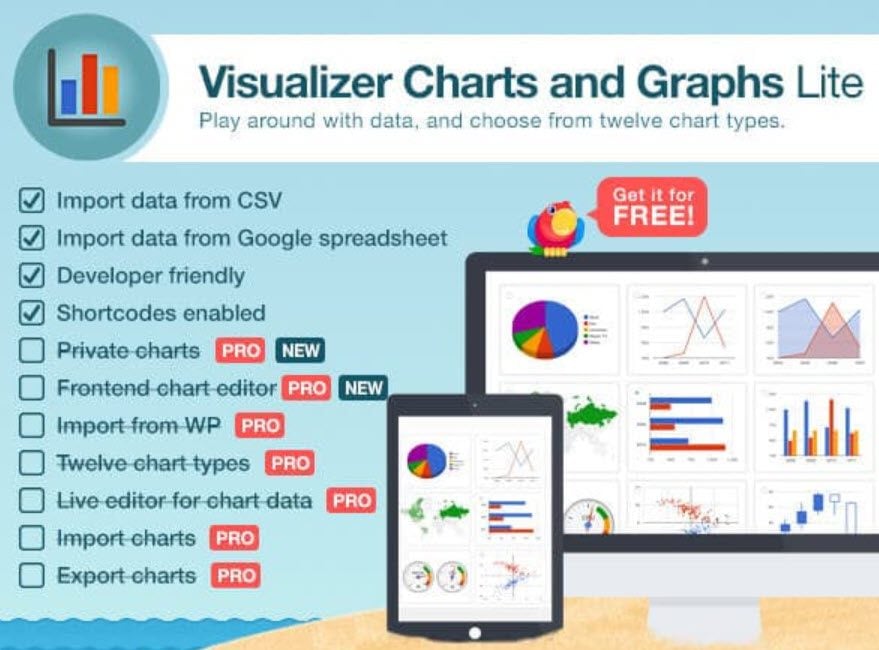
The Pro version does offer some really nice perks for the price, but you can do a lot with the free version that’s on WP.org. You do get more premium features and slightly more unique chart types, but unless you’re a power user who specializes in data and metrics, the free templates are pretty good.
You should also know that Visualizer is listed under the top Block Editor-enabled plugins, which is huge. While it still works perfectly well in the Classic Editor and in page-builder modules like those that come with Divi, the Block Editor is gaining traction and the more plugins that “just work” with it, the better. And this one does, as you’ll see in the examples below. It’s an easy integration because of shortcodes (that will only get better as the 2019 plan to expand blocks into other areas of WP gets underway).
Creating New Charts and Graphs
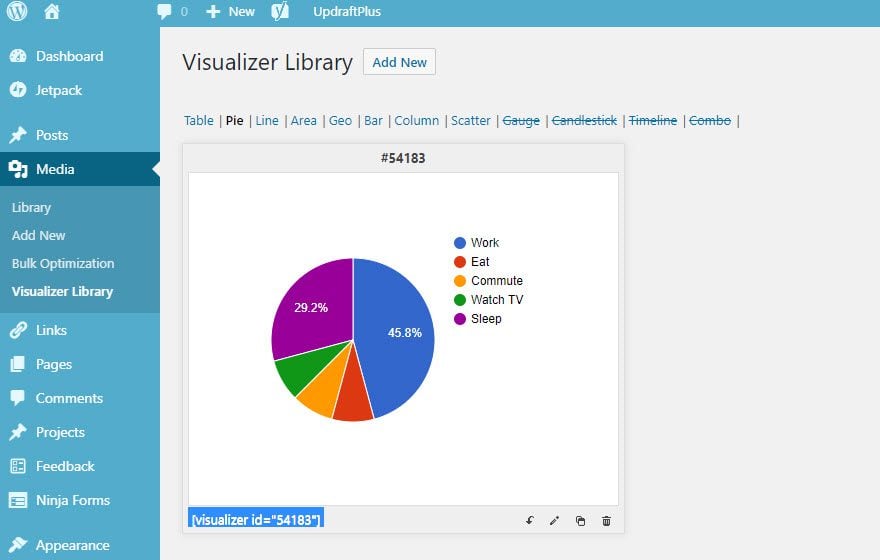
When the plugin gets installed and activated, you will find it under Media – Visualizer Library. The charts and graphs, however, do not get imported into your overall media library. They are self-contained within the Visualizer Library itself.
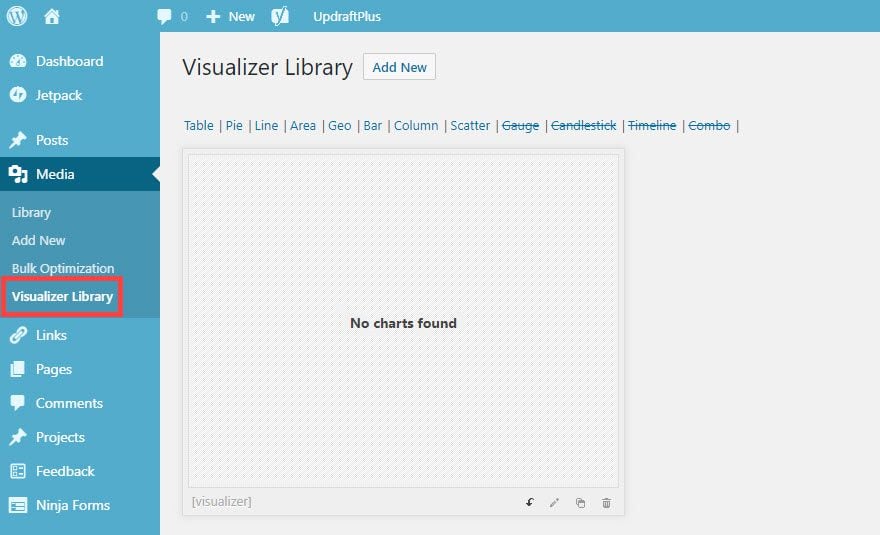
Note that some of the different options are struck out. Those are Pro options. But 8 out of 12 are free, so we count that as a win. More freemium plugins should be that confident.
More than that, more freemium plugins (and plugins in general) should be this simple to use. Since you don’t have any charts or graphs yet, press the Add New button at the top of the screen. You’ll be greeted by a pop-up modal asking you to choose what kind of chart or graph you want to create.
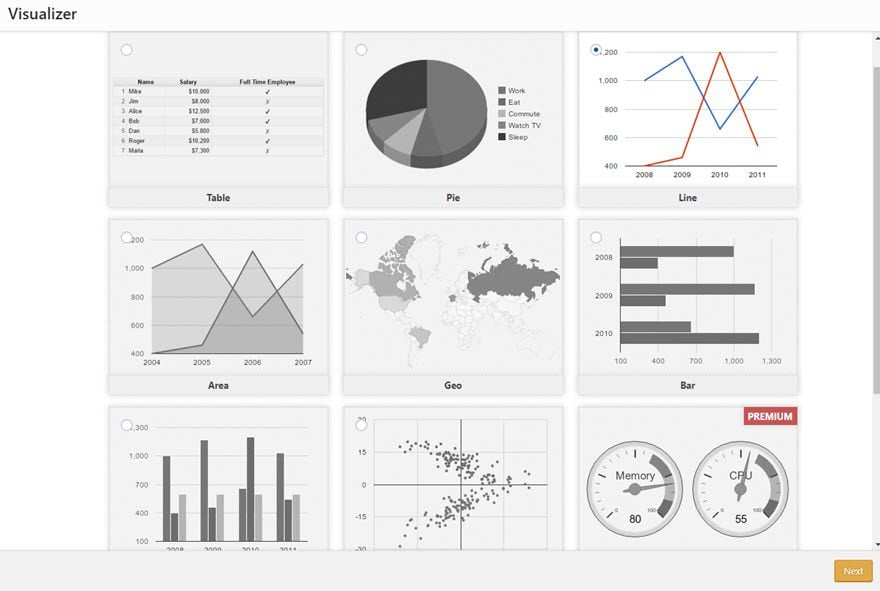 When that is chosen, press Next, and you get to the customization screen.
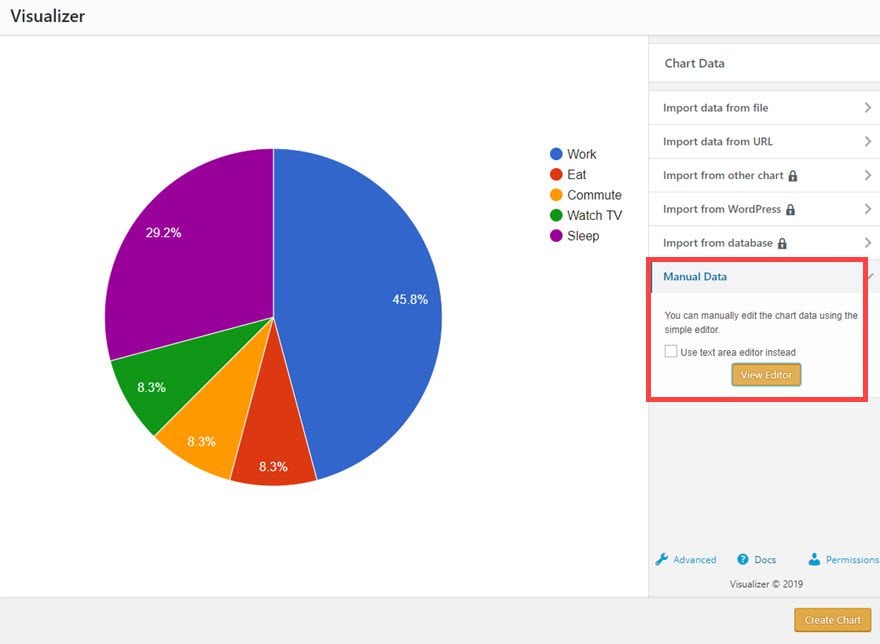
Depending on how you are going to be manipulating the data, you have a few choices here. Pro users have more, of course, but free users can still import data via CSV and Google Sheets (or hosted JSON files). For our purposes of the overview, though, we’re going to manually input the data. Which is conveniently found at the bottom of the tabs under Manual Data. Technically, you have two options here: the visual wizard or plain-text area.
If you check the Use text area editor instead, you will see an input field like this:
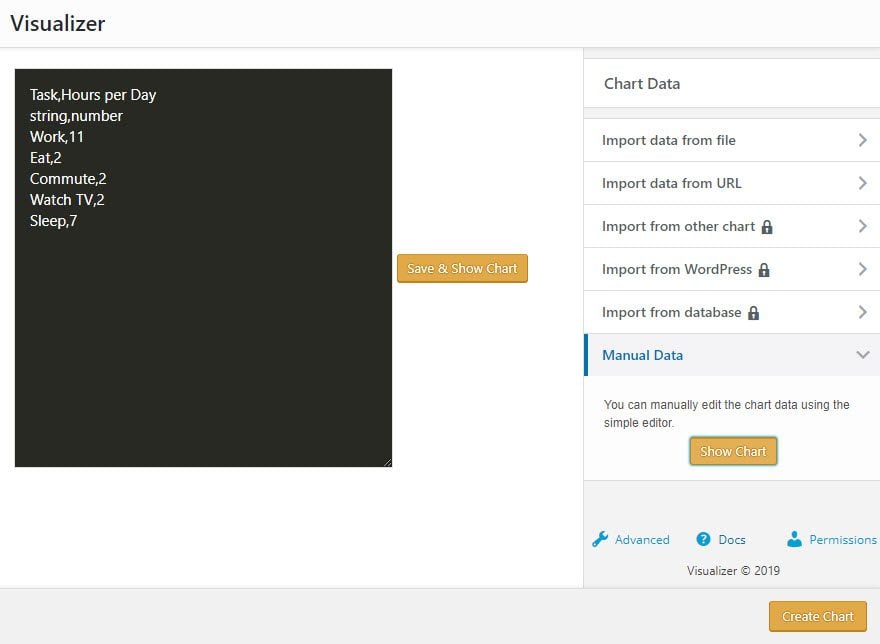
As you can see, it’s just a CSV file. You could even paste the information in. The left is the label, the right is the value. With a comma to separate them. Then you make the top line the label you want for each metric you’re showing. It’s easy to do. But the visual wizard is even easier:
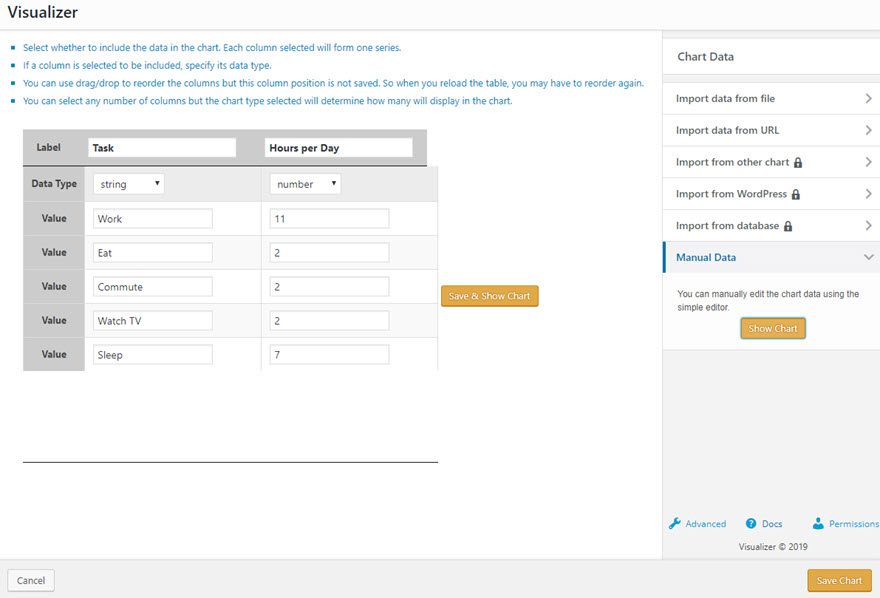
Regardless of your input method, the data will end up formatted the same way. When you save the chart, you will return to the main Visualizer Library screen. But your new chart or graph will be there.
Embedding Charts and Graphs
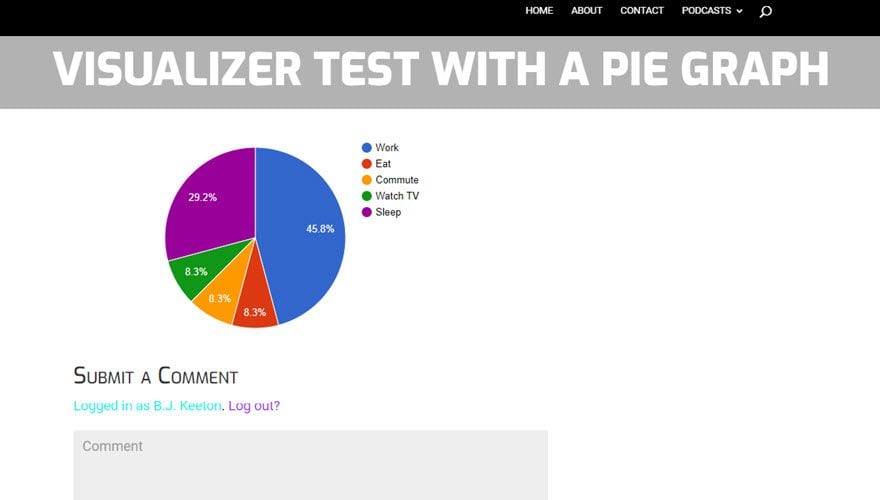
Lucky for everyone involved, the graphs and charts that Visualizer generates are easy to embed anywhere you want. They use shortcodes tied directly to the ID of the element you just created, so it’s as easy as copy/pasting that into any area on your site that can render a shortcode.
Thanks to the new Block Editor in WordPress, that’s easier than ever to find. You just paste the shortcode into a blank box to convert it to a Shortcode block (or choose the Shortcode block outright).
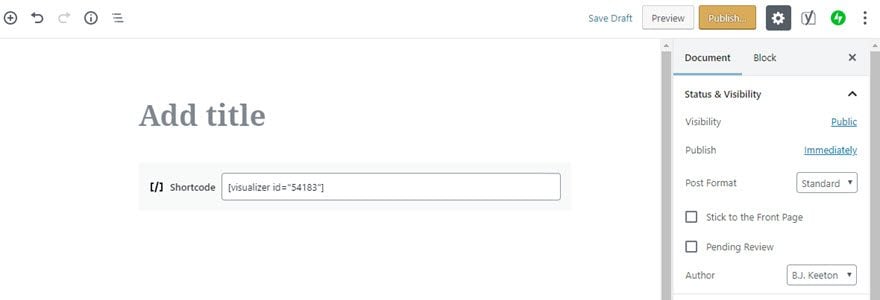
If you’re in Divi or the WordPress classic editor, don’t worry. It will render just like any other shortcode in pretty much any text area that you paste it into, main body, sidebar widget, footer, wherever.
An additional benefit to the plugin is that when the shortcode is embedded, the graphs are interactive. Users can mouse-over, for instance, a section of a pie chart for a more detailed look at that particular segment.
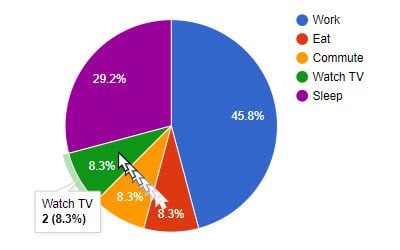
When you consider this is a free plugin that generates dynamic graphs and charts like this, we can’t help but be impressed. Many charts and graphs plugins limit the users to static images after creation that can’t be edited — only created and re-embedded. Visualizer is a welcome change from that.
Everyone Can Benefit From This Plugin
One of the best aspects of the plugin is that it’s relatively lightweight. It sits there in your media library and takes up very little space or server resources. This means that no matter what kind of site you run if you ever need to display data for any reason, you might as well install this plugin. By doing so, you open up the possibility of more engagement, a more dynamic website appearance, and the opportunity to reach a different kind of audience member.
After all, a picture is worth a thousand words. Any time a content creator can save a thousand words, isn’t that worth it? We absolutely think so. You can download Visualizer Tables and Charts from WP.org repository, and if you like it enough, head over to ThemeIsle to check out the Pro version.
Are you more interested in pure table plugins—check out our dedicated article on table recommendations.
What do you use data visualization for in your content?
Article featured image by wanpatsorn / shutterstock.com


I really need this plugin, My most of client use charts and table and this plugin helps me to create the great visual.
Installed the free version, very useful for simple graphs and charts.
Is this Plugin 100 percent compliant with DSGVO?
Under which circumstances?
Maybe ET and his authors can write each time, if a Plugin is in line with DSGVO – or otherwise: how to get there
Thanks , Daniel from Austria
In Europe we only use DSGVO compliant Tools due to legal reasons
It can be a little temperamental, but we have been using Visualizer on our Divi site for about 6 months now for all of our graphing needs. Easy to use, a lot of customization options for the design and unless you need fancier charts it’s all free!
I prefer to have the BLOG link at the top of the page, so I can quickly, easily, and conveniently catch up on the latest Blog posts.
Read the one star reviews of this plugin before doing anything !
Hi Nick
Just read the One Star reviews apart from the last entry the rest are over a year old they have lots of five-star recent reviews, just made a pie-chart and it works
regards
Adrian
Thanks B.J. Keeton good plugin for my project and free.