: What it is & How to Optimize your Website for it")
The First Contentful Paint (FCP) of your website is one of the most meaningful metrics in Google’s Core Web Vitals. In contrast with other paint and loading metrics, FCP isn’t a purely technical metric regarding response time. FCP is centered on the user’s experience and what they perceive first on the site, not what loads in the background. By optimizing your site’s First Contentful Paint, you are not only speeding up the overall load times and increasing page speed ratings, you’re also literally showing your visitors that their requests are being handled and that loading has not stalled.
In this article, we are going to go in-depth on what First Contentful Paint is, how to measure and optimize it, and answer some common questions about FCP so you can be sure that your site is as efficient and usable as it can possibly be.
Subscribe To Our Youtube Channel
What is First Contentful Paint (FCP)?
Your website’s First Contentful Paint is when the browser renders the first DOM element on your page. This includes images, canvas elements (non-white), or text. In plain English, FCP is when the user can see some part of your page change. Often, this comes as a header bar or background image. This element may not be the first thing rendered or loaded from the server, but it’s the first that the user can see, making it paramount to your site’s UX.
Anything that your website contains within an iframe is not accounted for with FCP. Nor is non-content painting such as a change in background color. That is First Paint, not First Contentful Paint.
FCP is an interesting metric. While you can quantitatively measure it, it’s also relatively subjective. Having a fast First Contentful Paint is important because it causes the user to perceive that your site is loading quickly. Whether or not it actually is. Your site might have a much longer First Interactive Delay (the time after which the user can engage with the site) than competitors, but it may appear to users as being faster because of your quicker FCP.
That said, FCP is not about tricking your users. A low FCP time is a good indicator of page speed in general, and the methods with which you optimize it can also affect other page-speed metrics (such as Largest Contentful Paint).
How to Measure FCP
Even though FCP is important because of user perception, it is a quantifiable metric that you can measure and grade. That said, however, you can use these tools to indicate whether the FCP’s impact in the field (with real users) versus in the lab (simulated page loads for testing purposes).
What is a Good FCP Score?
Before you dig in with the various tools for checking your FCP, you need to know what is considered a good FCP score. From Google’s documentation on determining metric scores, we can see that they rate FCP times in three categories—good, needs improvement, and poor—and discusses how they achieve the percentile scoring used by their Lighthouse tool.
- Good – between 0 seconds and 1.8 seconds
- Needs Improvement – between 1.8 seconds and 3 seconds
- Poor – over 3 seconds
Below, we’ve listed various tools that you can use to see in which of these categories your site lands.
Field Tools
Field tools are those which you can use to track how the page appears to your users. Real users. These tools don’t rely on APIs and assumptions about your site. They run directly against your server in real time so that you get the most accurate and up-to-date information as possible.
Google’s documentation for FCP on https://web.dev shows these as the best field tools for determining FCP:
- PageSpeed Insights
- Chrome User Experience Report
- Search Console (Speed Report)
- Web Vitals JavaScript library
Additionally, perhaps the best tool is Real User Monitoring (RUM). That’s where you track and watch real users interact with your site. You can track their load times quantitatively using the tools listed above, and then you can get their subjective perceptions of FCP and your page load speed from them directly. In terms of the most complete view of FCP and its impact on your visitors, RUM is definitely the top of the list. However, it is also the most complicated and hard to conduct.
Lab Tools
Lab tools for FCP checking tend simulate results as to what your FCP would be under ideal situations. Rather than real-world situations where latency, bandwidth, network congestion, and other roadblocks occur, these lab tools recommended by Google provide a look at what your site can be when running optimally.
Also, when you’re developing a site that has not yet reached production, it is impossible to test it under real-world conditions. Using lab tools can also help you create benchmarks and milestones as your project moves through the development cycle.
How to Optimize Your FCP Score
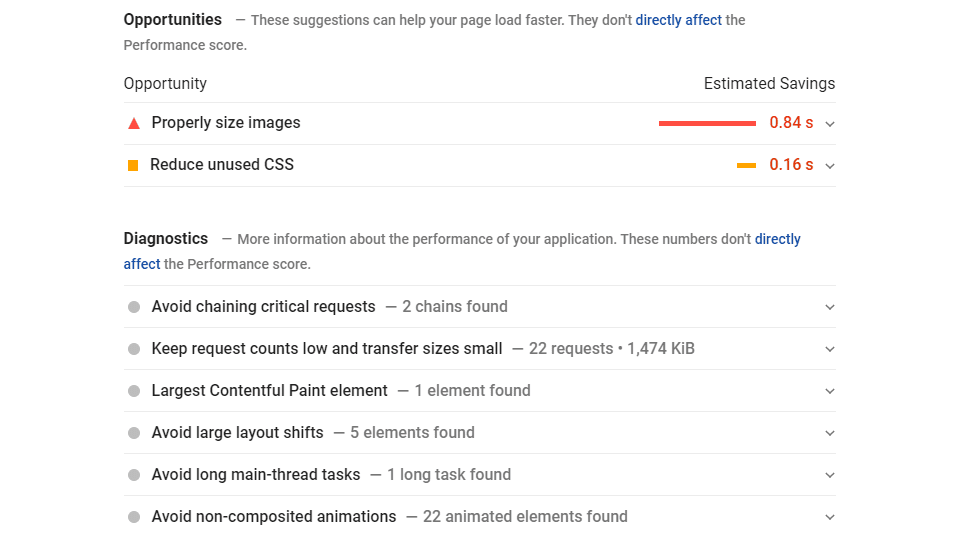
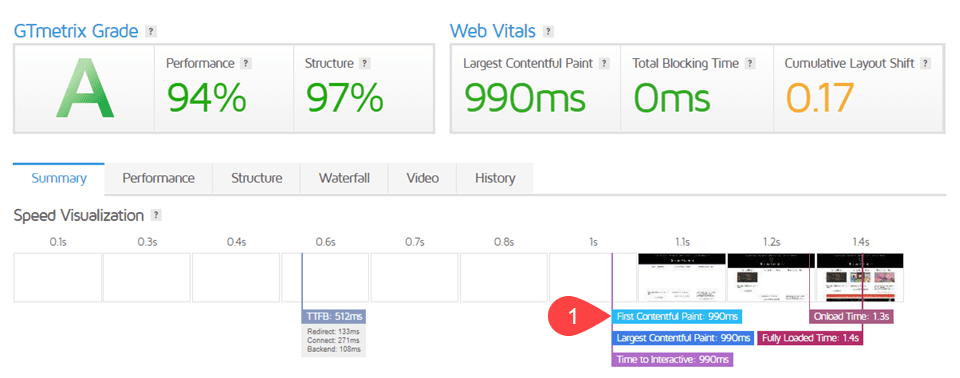
The tools above give you an overview and score of where your website speed and FCP are, sure. But they—as well as others such as GT Metrix and Pingdom—also give you insights into what you can do to optimize your FCP score and make it paint even faster. We are going to go through an overview of what some of the most common steps for how to fix First Contentful Paint times so that you know how to address anything the tests and tools shoot your way.
Remove Render Blocking Resources
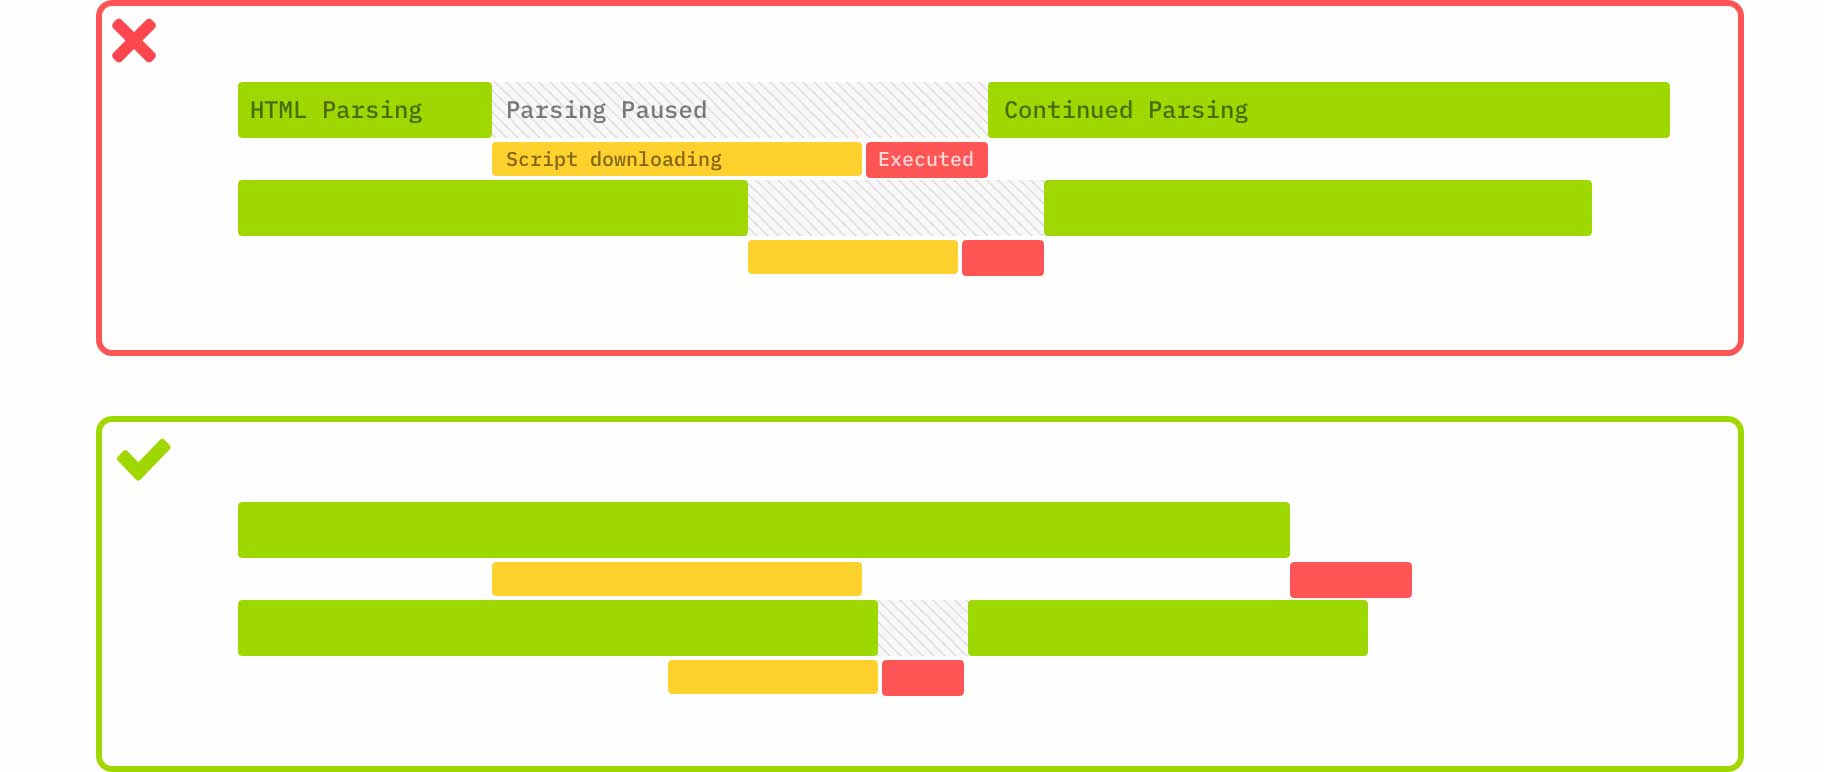
This might be the number one on-page factor for lowering your FCP time. Render blocking resources are files on your website that your page must have to render. These include HTML, JavaScript, fonts, and CSS files. What makes them “render blocking” is that they take priority over anything else on the page, halting the loading process of anything else until they finish. Any images, plain text, or other user-facing content is put on hold until the vital files are finished.
This hold causes a dramatic increase in FCP for two reasons:
- render blocking files are generally large in size
- render blocking files don’t usually contain site content, only structure and formatting
By removing these resources from the critical rendering path, you open up space for contentful painting. You can defer the loading of the resources, avoid using @import for CSS (use @media for conditional CSS instead), and make sure to minify and combine your CSS, HTML, and JavaScript files (which we discuss later in this article).
Additionally, Divi users get to take advantage of our Critical CSS system which automatically removes each and every render blocking CSS request. On top of that, the theme has speed-boosting options that help immensely with this. Not only does it cache Google Fonts and print them in-line in the header (avoiding @import), Divi also lets you choose to remove WordPress’s native and (likely) unused emoji that take up resources for FCP, toggle jQuery deferral, and defer the Gutenberg block editor stylesheet from rendering first and blocking other resources. That’s why Divi performance is so great and can help you achieve great FCP scores right out of the box.
WordPress users without Divi might also find some render-blocking options in their WordPress caching plugins like WP Rocket, and enabling those will also help decrease FCP time.
Display Text Before and During Font Loading
Have you ever seen a website where all the text on a page magically appears all at once when all of the other content exists around it already?
That’s because the browser is hiding it. The site’s text content doesn’t load until it’s ready to read. Text is generally only a handful of bytes’ worth of content. But on many sites, it can take exponentially longer to load. Because the font file isn’t “ready” for display. Of all ways to have a blazing fast FCP time, getting your site’s text content painted is perhaps the best.
You can use various font-display parameters, you can tell the browser to load your site’s text using a system font immediately, and then to replace it with your specified display font once it’s loaded.
Text content is minimal in file size, often just a few bytes, and by telling browsers to display it without delay has the potential to make your FCP almost non-existent. Simply add font-display:swap to any @font-face CSS you have. That alone might fix a lot of your First Contentful Paint time issues.
Divi does this by default, so our members will not need to make any changes. Your sites will automatically swap from a system font rather than hide your page’s content until files are fully loaded.
Minify Your HTML, CSS, and JavaScript
Minification is taking out extraneous characters (such as spaces) from your site’s HTML, CSS, and JavaScript files. While spacing makes it easier for humans to read and parse, browsers and servers don’t need them. Those spaces are still characters that take up bytes. By minifying things like your CSS files, you decrease the page size. Which increases page speed and improves the time to FCP.
If you are a WordPress user, you likely have a minification option in your theme or speed optimization plugin already. For Divi users, that’s taken care of for you already. Divi will automatically has enqueue its minified version of scripts. With those enabled, your FCP will drop.
Take Out Unused CSS
If you have code in your stylesheets that isn’t being used, then why keep it? Any old or unused code should be excised so that it’s not being loaded each time your site is requested. Chrome DevTools (which we linked to above) can show you under the Coverage tab which parts of your CSS is being loaded but not rendered.
Additionally, Divi users should take note that we have completely overhauled the way our theme handles CSS and this kind of style bloat. Our massive Divi performance update keeps CSS dynamically sorted into small, minified files that are based on the modules you’ve chosen on your page. On top of that, we identify what parts of that CSS loads above the fold and render that first. And that reduces your FCP.
So not only have we automatically minified your CSS, we’ve also chopped it into bite-sized morsels for your browser and prioritized those that increase FCP and overall page load times.
Reduce Time-To-First-Byte (TTFB)
Essentially, TTFB is when the very first byte of data is transferred to the browser. FCP hinges on this metric, so the faster it is, the faster your First Contentful Paint is. The best methods of reducing TTFB and speeding up your page are pretty simple:
- use a quality host
- deliver content via CDN
- enable browser caching (with WordPress, through a plugin like WP Rocket)
Making sure those three elements are taken care of adequately can dramatically decrease TTFB, and by extension, your FCP.
Keep Your DOM Size Small
This might be a gimme. But often one of the largest limiting factors of having a quick First Contentful Paint is having an overly large DOM. You’re trying to do too much right off the bat. Google says that “the sweet spot is a tree dept <32 elements and fewer than 60 children/parent elements.”
Many of us overcomplicate our home pages and landing pages in an attempt to impress visitors. However, these added elements bloat the DOM and cause a higher FCP time. You can help this by lowering the number of CSS selectors that you use, maybe using far more class-based CSS than ID or special media queries. Pseudo-selectors also complicate matters and increase the size of your DOM.
Along with that, you can lower the number of elements the selectors apply to. It takes less time to load and apply styles 5 elements than 10. This is especially true with older and outdated browsers, which despite all of our best efforts, people still use daily.
Use SVG or WebP Images
This one may not affect everyone’s site which is why we’ve included it last on our list. Images aren’t usually the first thing to paint onto a page, especially over text or additional frames, but it’s possible that significantly lowering the file size of important/prominent images (such as your site logo) can help with FCP.
While .gif, .jpg, and .png are the most common image files you’re using, if you swap those to either .webp or .svg files, you will save a lot of time. With file sizes in the bytes range sometimes rather than kilobytes, your images will load in a blink. If you’re a WordPress user, version 5.8 has built in .webp support, and we have a rundown on how to use SVG images in our archive.
Most likely, this method will affect your Largest Contentful Paint (LCP) more than FCP, but a small enough SVG logo can certainly be the first thing your users see.
First Contentful Paint (FCP) Frequently Asked Questions
How Does FCP Fit into My Website’s Overall Performance?
As a direct metric of site performance, not a lot. FCP is a user-centric, perception metric that isn’t necessarily indicative of site performance. As we mentioned earlier in the article, two websites might have the exact same loading time, but the one with a lower FCP time might be seen as being faster. That perception can affect user experience, if not overall website performance.
However, First Contentful Paint is a fantastic metric to follow in order to bring the overall site performance to a higher level. Any actions that you take to lower FCP will also lower your overall page speed. So you can almost take it as a signal of your overall performance.
A low FCP time generally won’t coincide with a high overall load time, so if you need to use a single metric to see where you stand, FCP can be a good guidepost. You can also pair it with LCP, or the Largest Contentful Paint, to get a more complete picture of what your users see in the first few seconds of coming to your site.
What’s the Difference Between First Paint and First Contentful Paint?
Though the two terms may occasionally be used interchangeably, they are technically two different metrics. As we’ve discussed, First Contentful Paint is when the browser renders the first DOM element on the page. You can think of this as any usable (if not interactive) content on the page. A background image, text, or your header menu div, for example.
First Paint, however, is when the browser renders the first bytes of information, whether it’s contentful or not. A change in the background color (not the loading of a background image) isn’t contentful. The user cannot consume it as content, therefore not being an example of FCP.
The First Paint can be the exact same your First Contentful Paint. But your FCP may not be the same as your First Paint.
Conclusion
FCP is an absolutely vital metric for your website. Google values page speed as one of the most important aspects of your page ranking. Users see page speed as one of the deciding factors on whether they stay on your site. Having a low First Contentful Paint can keep users on your site and help them find your website in the first place. Even though FCP is often a hard metric to nail down and grasp, any optimizations on reducing FCP time will increase UX and go into shaving off precious seconds and milliseconds off your site’s overall loading times.
What are your top strategies to have a fast First Contentful Paint?
Article Featured Image by victoria pineapple / shutterstock.com


By Far the best i have read in the recent time about Site Speed, you have explained it in very simple language,
thanks so much.