
If you work with a lot of websites, you’re probably always on the hunt for faster, more efficient ways to get things done. If so, the Inspect Element tool, available in most major browsers, could be a useful asset to have on hand. With it, you can quickly identify CSS classes, preview changes to elements on a page, simulate a site on mobile devices, and much more.
In this article, we’ll introduce the Inspect Element tool and show you how to access it in the most popular web browsers. Then we’ll walk you through some examples of how you can use it as part of your web development workflow.
Let’s dig in!
How to Access the Inspect Element Tool in Major Browsers
The Inspect Element tool is a utility that enables you to view the underlying source code of any webpage. Additionally, you can use it to make temporary changes and see the results in real-time while leaving the original source code intact. This is incredibly useful if you need to test a change or diagnose a problem. It can also come in handy if you encounter a site with a feature you like and are curious how it was implemented.
Most major browsers – including Chrome, Firefox, and Safari – offer a variation of this tool. Let’s look at how to access it in each of them.
Accessing the Inspect Element in Google Chrome
There are three ways to access the Inspect Element tool in Chrome:
- Right-click on an element on the page and choose Inspect.
- Click on the three-dot menu in the upper right corner of the window and choose More Tools > Developer tools.
- Press Ctrl + Shift + C on your keyboard (Cmd + Option + C on Mac).
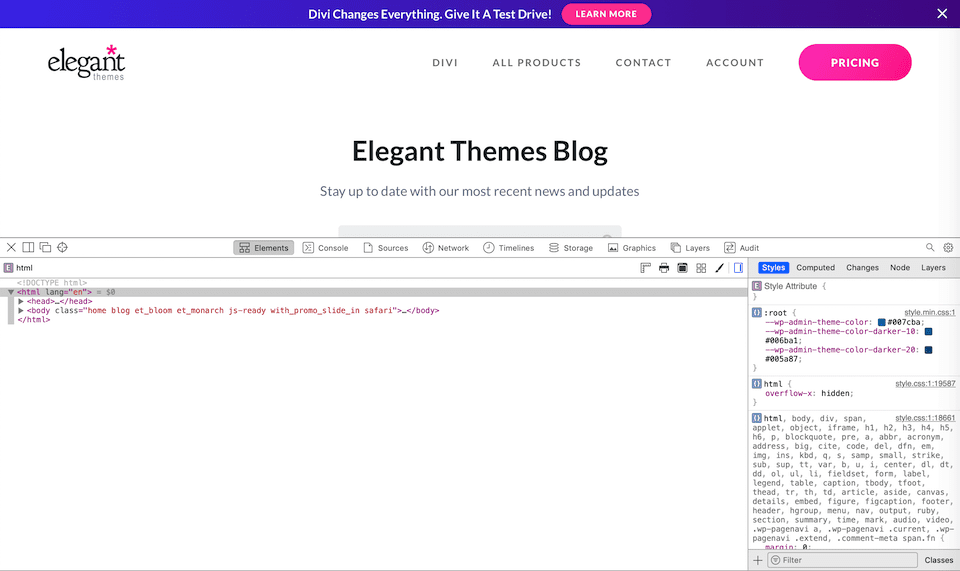
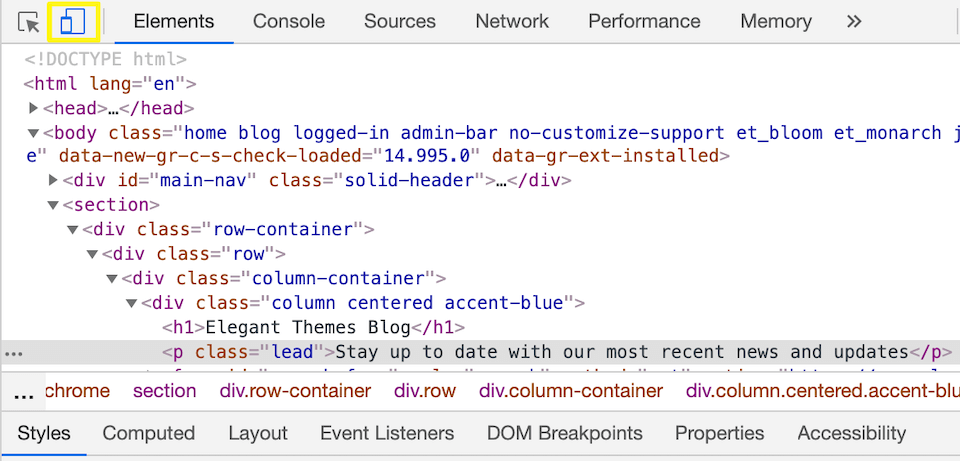
When the tool opens, it will present you with a split view. On one side, you have a preview of the website you’re inspecting, along with a few controls to adjust the view and simulate different screen resolutions:
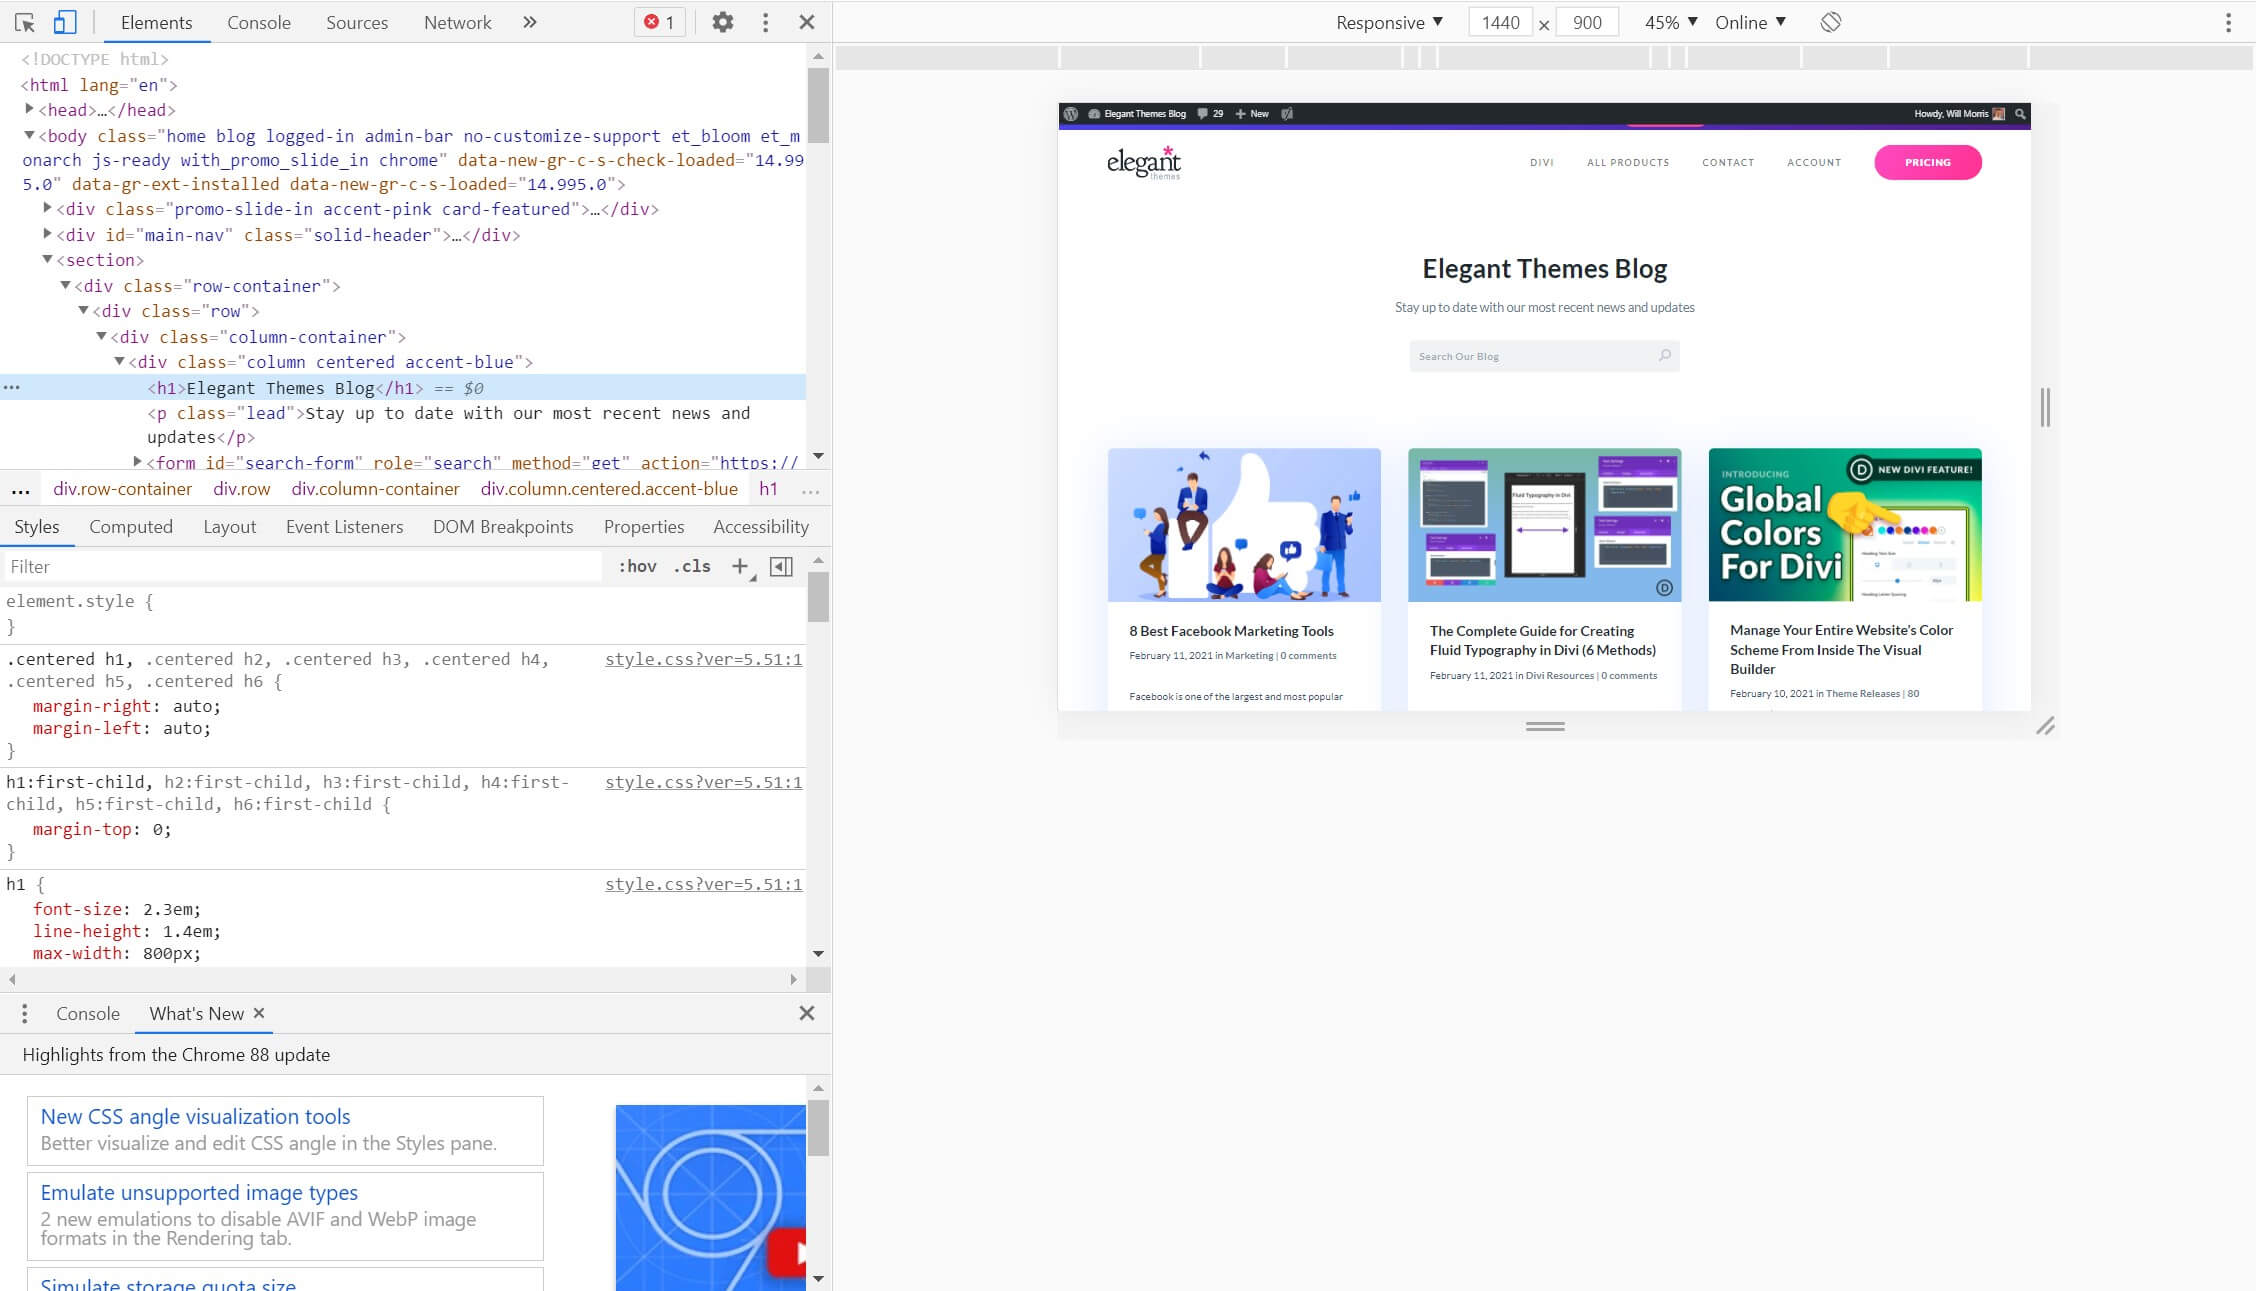
On the other, there are several panes containing information. The top pane is the HTML for the page. Hovering over part of the code will highlight the relevant area of the page on the right:
Below that is a pane showing information about the page. The details displayed here vary depending on which of the tabs you select. In the screenshots above, it’s showing the page’s CSS styles.
The bottom pane is simply news and updates about the Chrome Developer Tools. You can safely close this to reduce clutter by clicking on the X.
Finally, you can change the location of these panes by clicking the three-dot menu in the upper right corner of the HTML pane and selecting one of the dock options.
Accessing the Inspect Element in Mozilla Firefox
The Inspect Element tool in Firefox is fairly similar to Chrome’s and can be accessed in similar ways:
- Right-click on an element on the page and choose Inspect Element.
- Click on the hamburger menu in the upper right corner of the Firefox window and select Web Developer > Inspector.
- Press Ctrl + Shift + C on your keyboard (Cmd + Option + C on Mac).
Firefox defaults to placing the information panes on the bottom of the screen:
However, you can easily move them by clicking on the three-dot menu and selecting a different option.
Accessing the Inspect Element in Safari
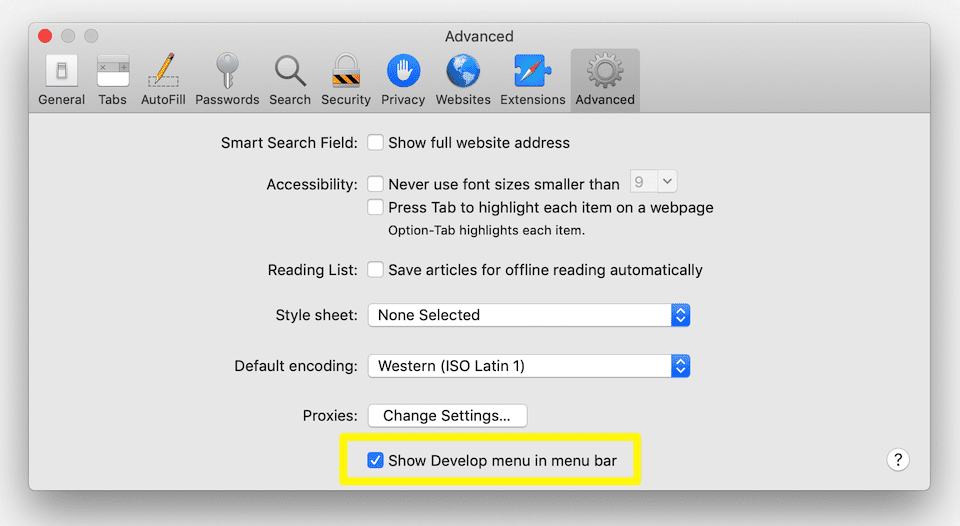
On Mac computers, the Safari web browser also offers an Inspect Element tool. However, there’s an extra step to accessing it – you’ll need to enable the Safari developer tools.
To do this, head to the menu bar at the top of your screen and navigate to Safari > Preferences > Advanced. You can then check the relevant box to enable the dev tools:
Once enabled, you can access the Inspect Element feature much like in other browsers:
- Right-click on an element and choose Inspect Element.
- In the top menu bar, navigate to Develop > Show Web Inspector.
- Press Cmd + Option + I on your keyboard.
The initial layout for Safari’s tool differs a bit from the browsers:
However, as with Chrome and Firefox, you can easily customize it by clicking on the icons in the top left corner of the inspector window.
5 Common Uses for the Inspect Element Tool
Now that you know how to access the Inspect Element tool, let’s look at some of the useful things you can do with it. There are tons of possibilities, but the uses below are some of the most common. Note that we’ll be using Chrome for these examples, but the features should work similarly in other browsers.
1. Find CSS Classes on a Website
One of the most useful ways you can leverage Inspect Element is to find details in a page’s Cascading Style Sheets (CSS). This is handy for a couple of reasons. First, if you’re just browsing the internet and come across a site that you really love the style of, you can peek at the CSS to collect some ideas for your own web design.
It’s also useful on your own site. For example, if an element doesn’t look quite right, you can quickly inspect it to make sure it’s using the correct CSS.
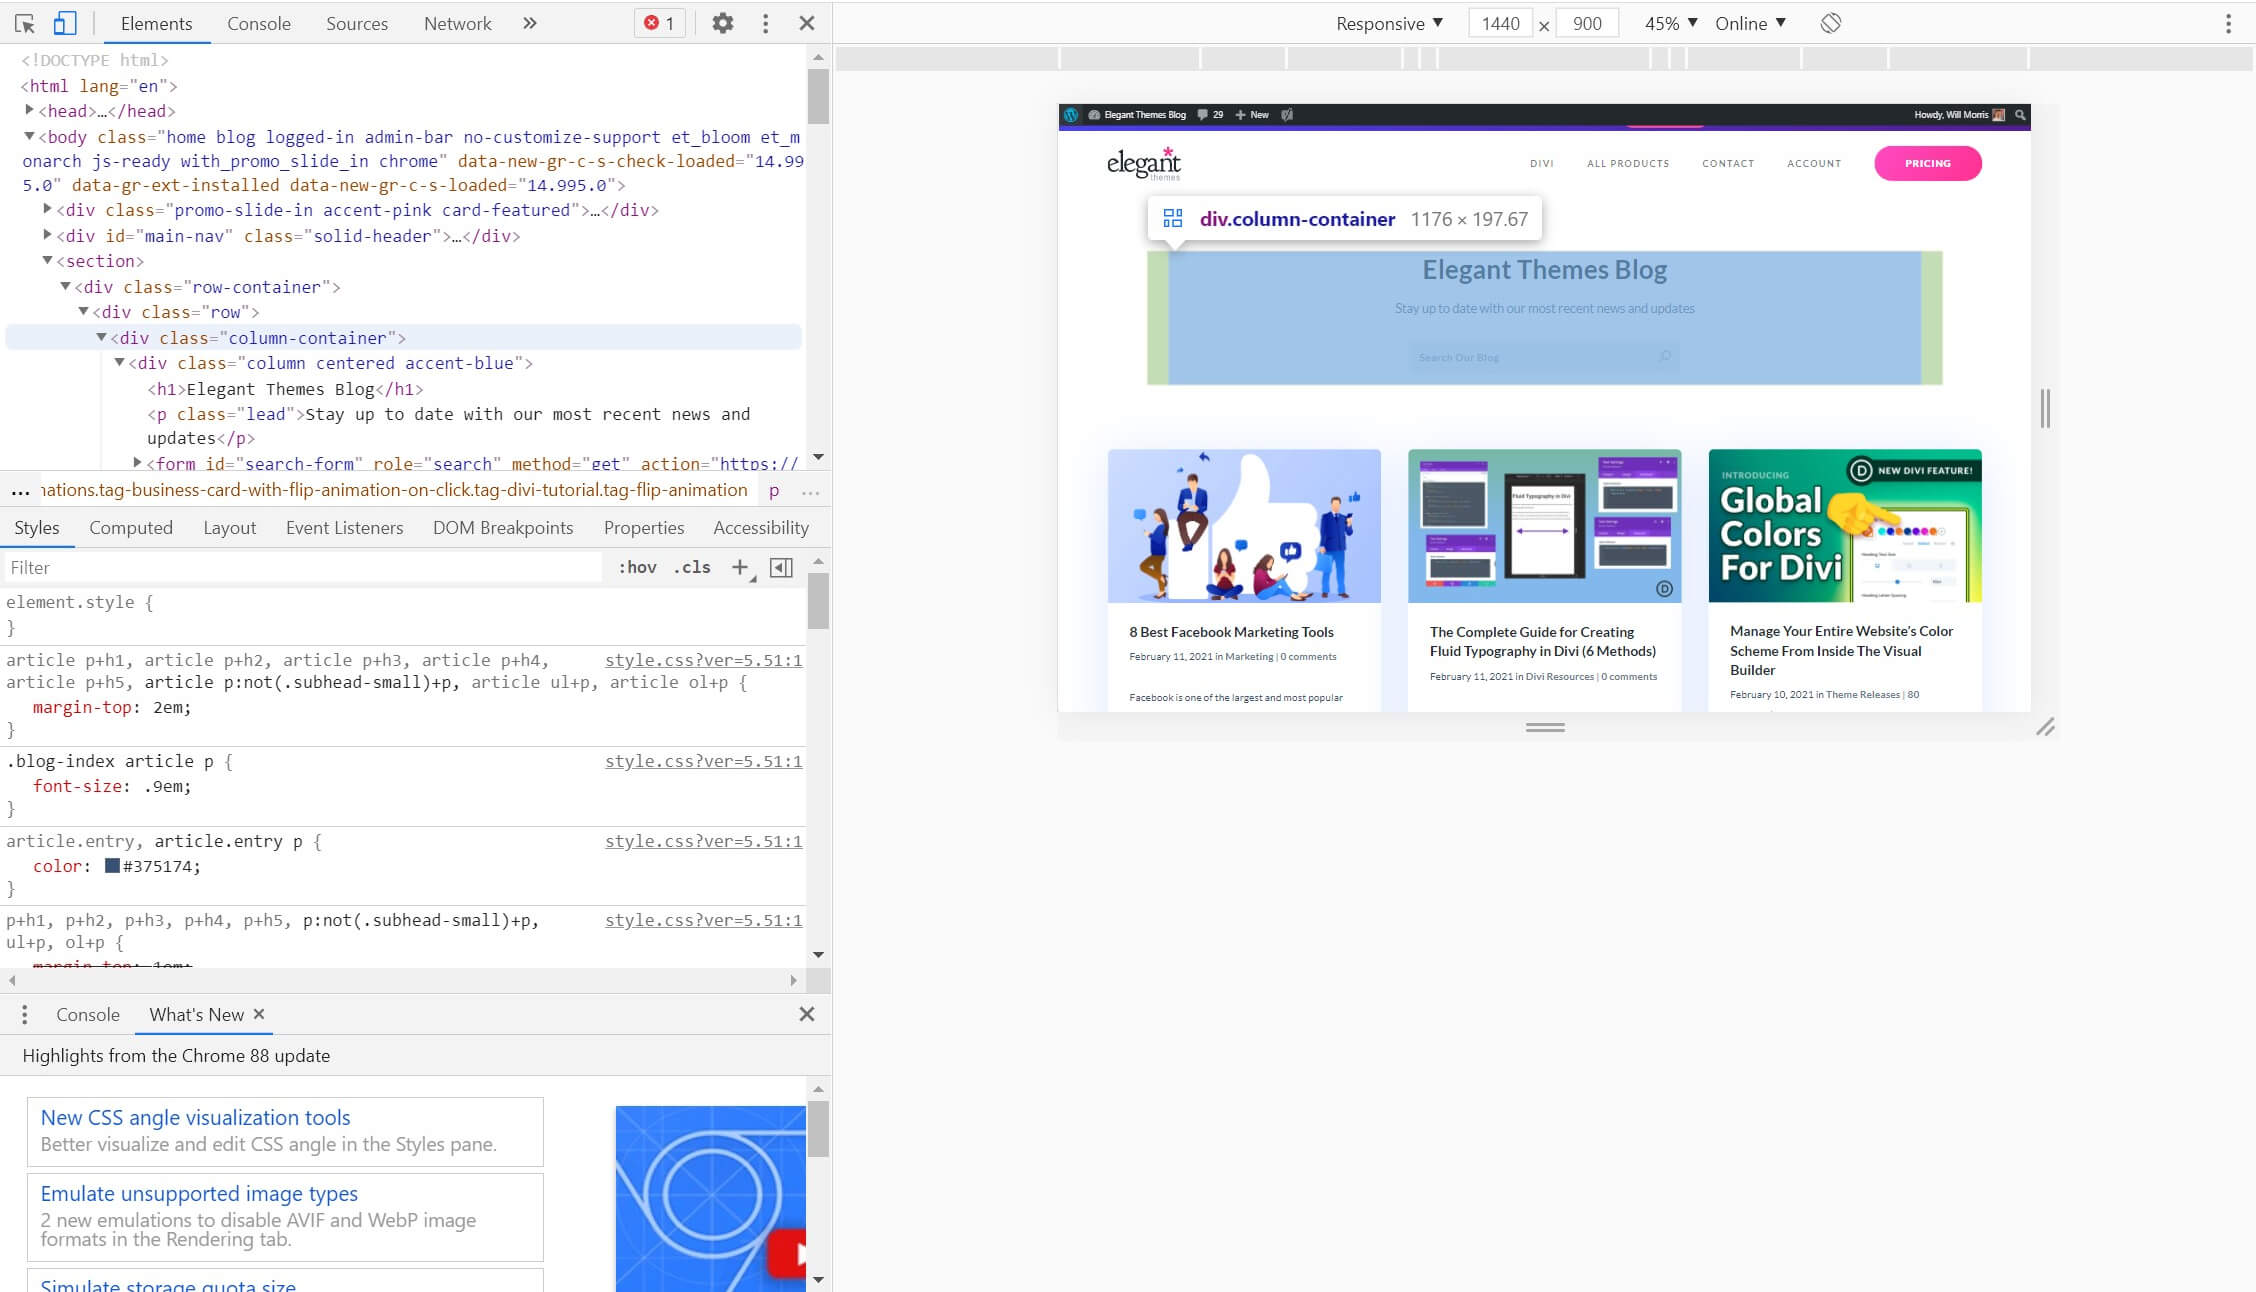
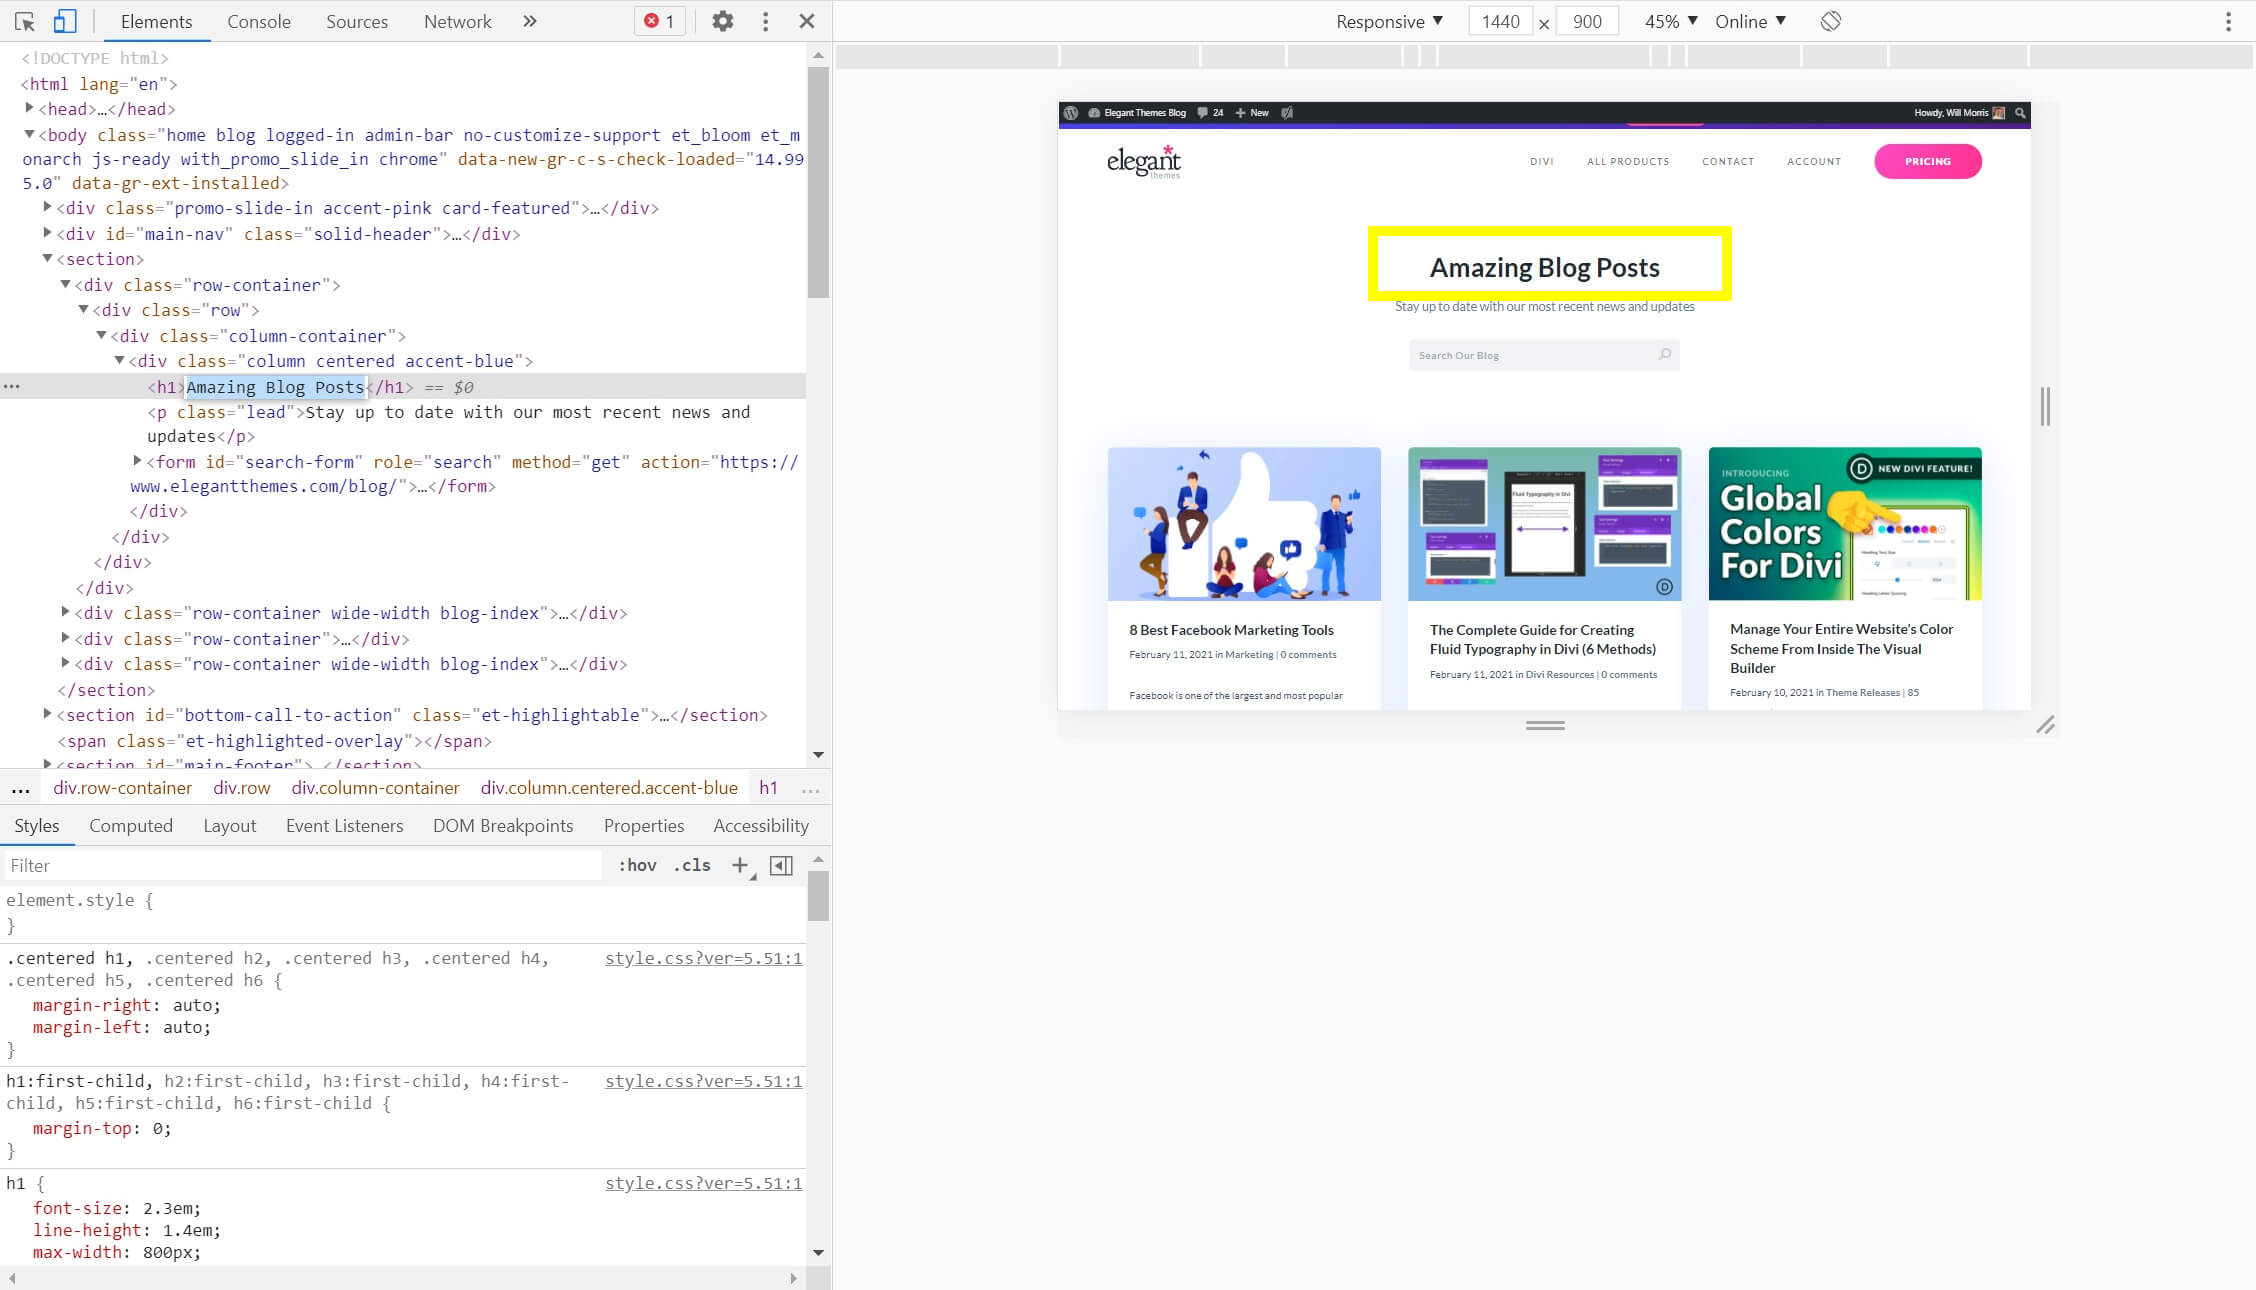
There are two basic ways to check styles using Inspect Element. If you want to quickly view a single item, you can hover over it in the preview pane to see some basic information about it:
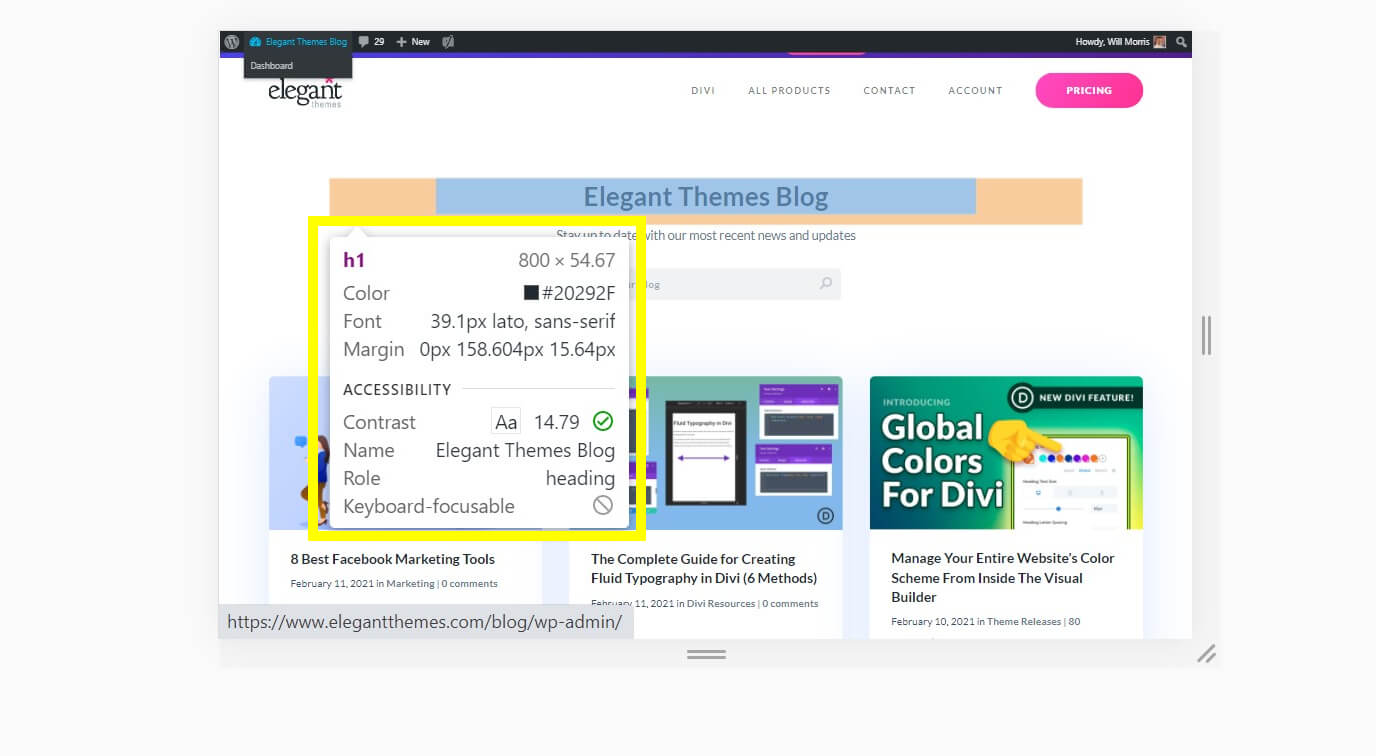
Here, you can see the color scheme, font, margins, and more for the header on our blog. In the detailed panes, the tool also highlights the relevant code so you can see exactly what’s going on. Clicking on an element in the preview will update the styles pane to show its CSS as well:

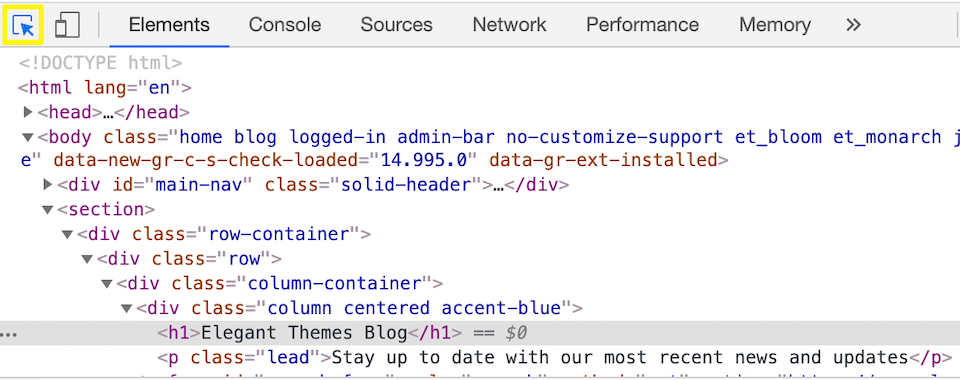
If hovering over the element doesn’t seem to be doing anything, ensure that the cursor icon in the inspector pane is highlighted in blue:
In the event that you know the specific CSS class or style you’re looking for and want to see every element that’s using it, you can also use the search function. With the inspector open, press Ctrl + Shift + F on your keyboard (Cmd + Shift + F on Mac). This opens a search box where you can search the page’s code. Relevant results will be highlighted, just like if you were searching a document.
2. Troubleshoot a Site
The Inspect Element tool is extremely handy for troubleshooting issues. For example, if the color or font of an element doesn’t look quite right, you can quickly check it using the tool as we described in the previous section.
You can also directly edit a page’s HTML from the Inspect Element tool. Simply double-click on the code you want to change to edit it.
Note that the code isn’t actually changed on the website – if you refresh the page, it will revert to its original form. However, this functionality is extremely useful for quick tests and troubleshooting.
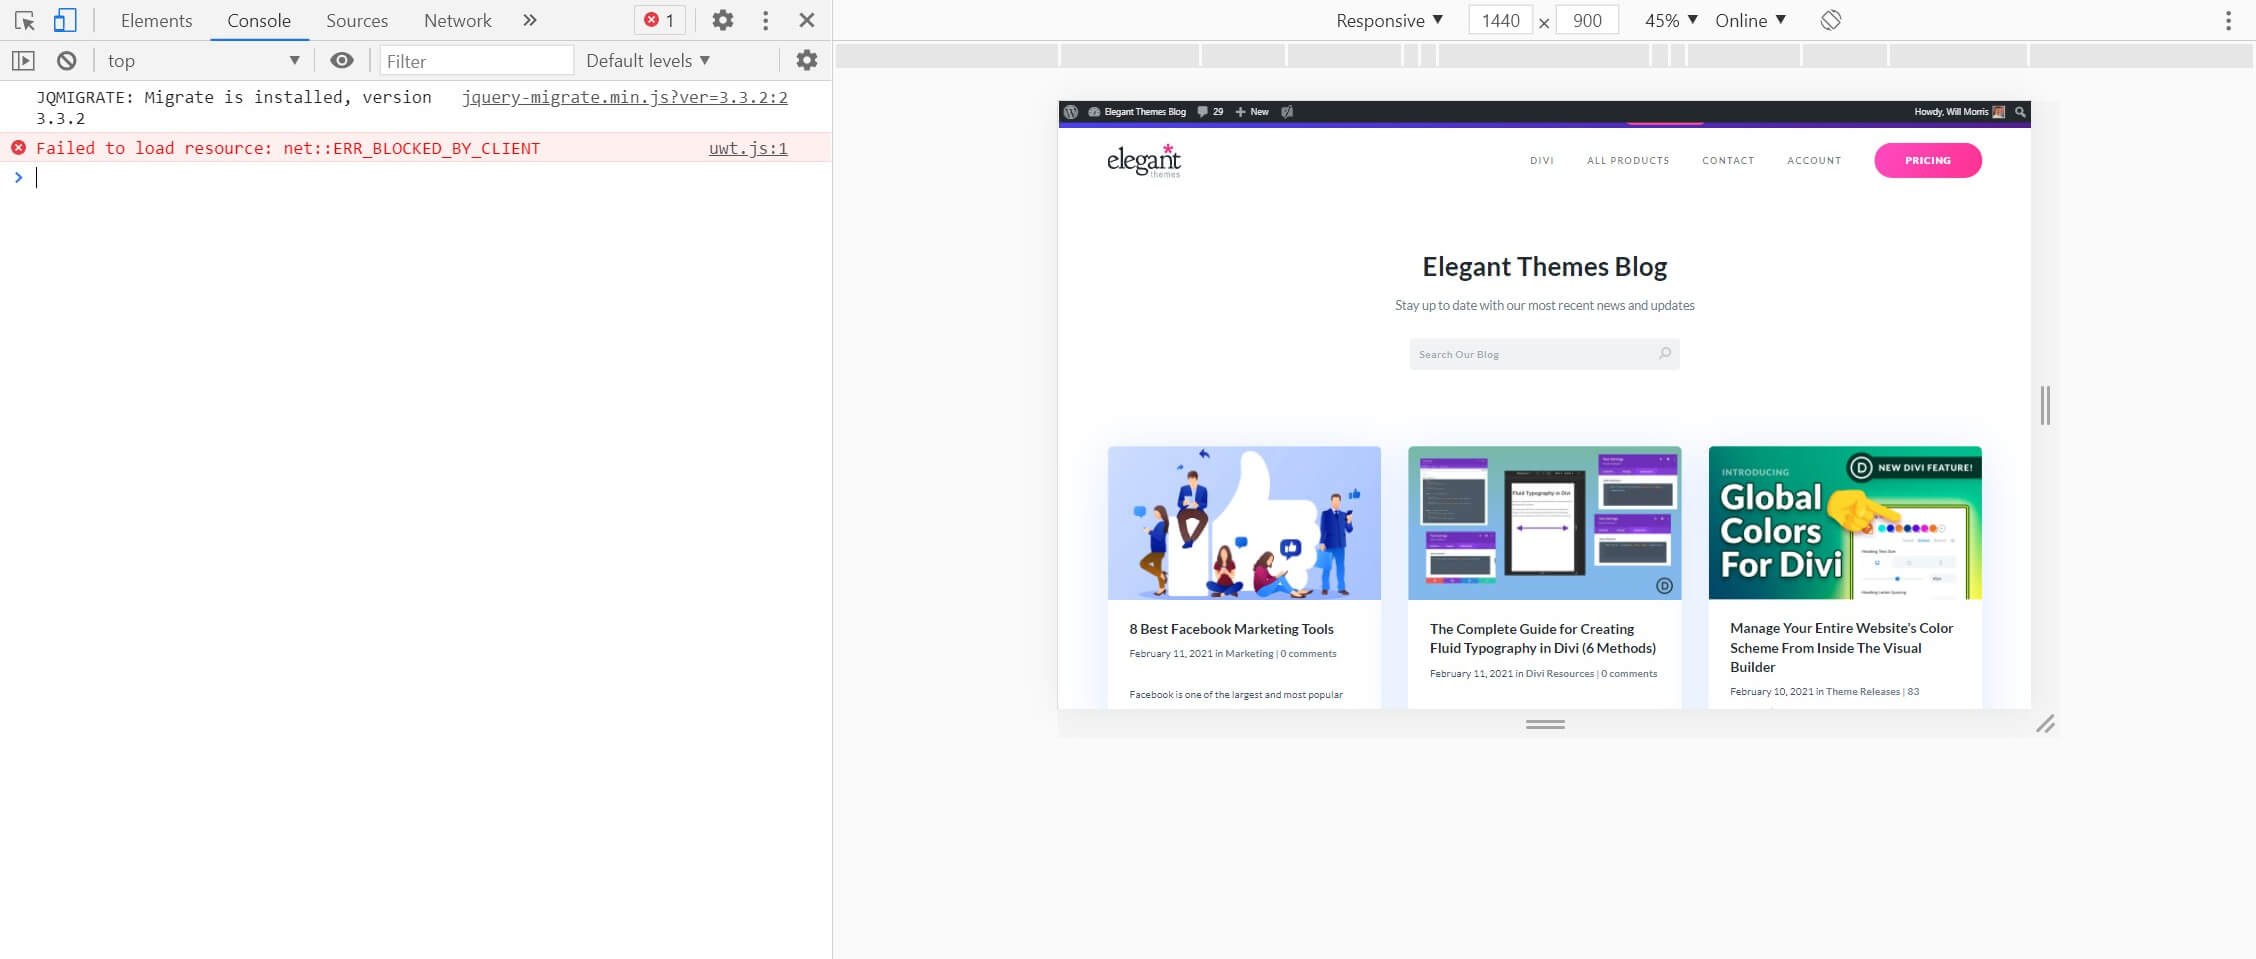
Finally, the built-in debugger is a more advanced tool you can use to see any error messages that are being thrown up behind the scenes. To access it, click on Console at the top of the Inspector window:
There are also other tabs available for viewing sources, network activity, and more. To access the full list, click on the double-arrow icon at the top of the inspector.
3. Edit Text to Preview Changes
One of the best uses for Inspect Element is to quickly preview changes to the text, font, or color of a page. This way, you can see exactly what your idea looks like without even logging into your WordPress dashboard.
To edit an element, right-click on it and choose Inspect. This opens the tool with that element’s code in focus. If you already have Inspect Element open, you can also click on the item in the preview pane to highlight the relevant code.
Next, just double-click on the code to make it editable. For example, here we’ve changed the title of our blog:
You can also change colors. Simply select the element and scroll through the Styles pane to find the relevant section. You can click on the color squares to pull up a color picker:
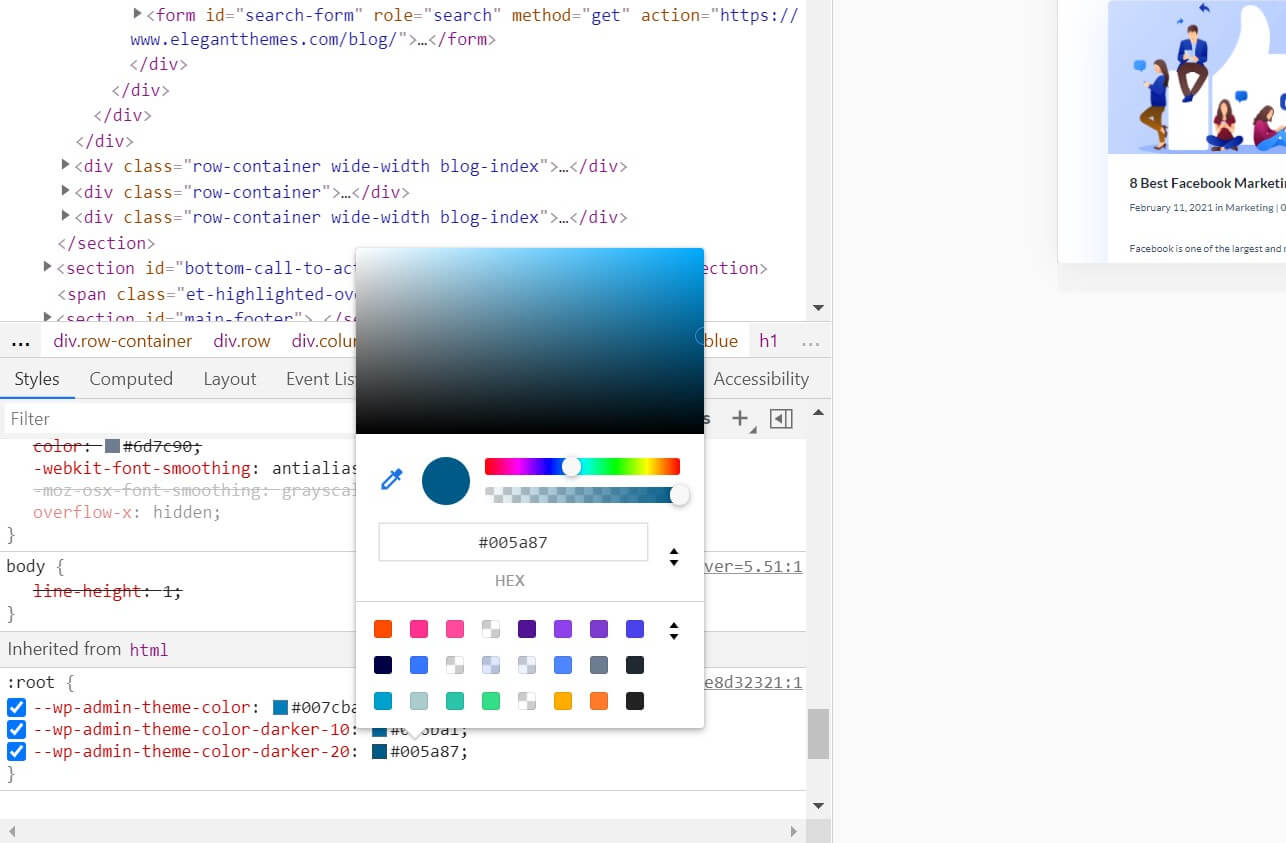
You can also edit the color’s hex code directly if you know the one you want to use.
4. Preview Image Changes
Inspect Element also makes it easy to preview image changes. This is an excellent way to try out different image sizes, as well.
Simply select the image you want to change in the preview pane, then double-click on its URL in the HTML pane:
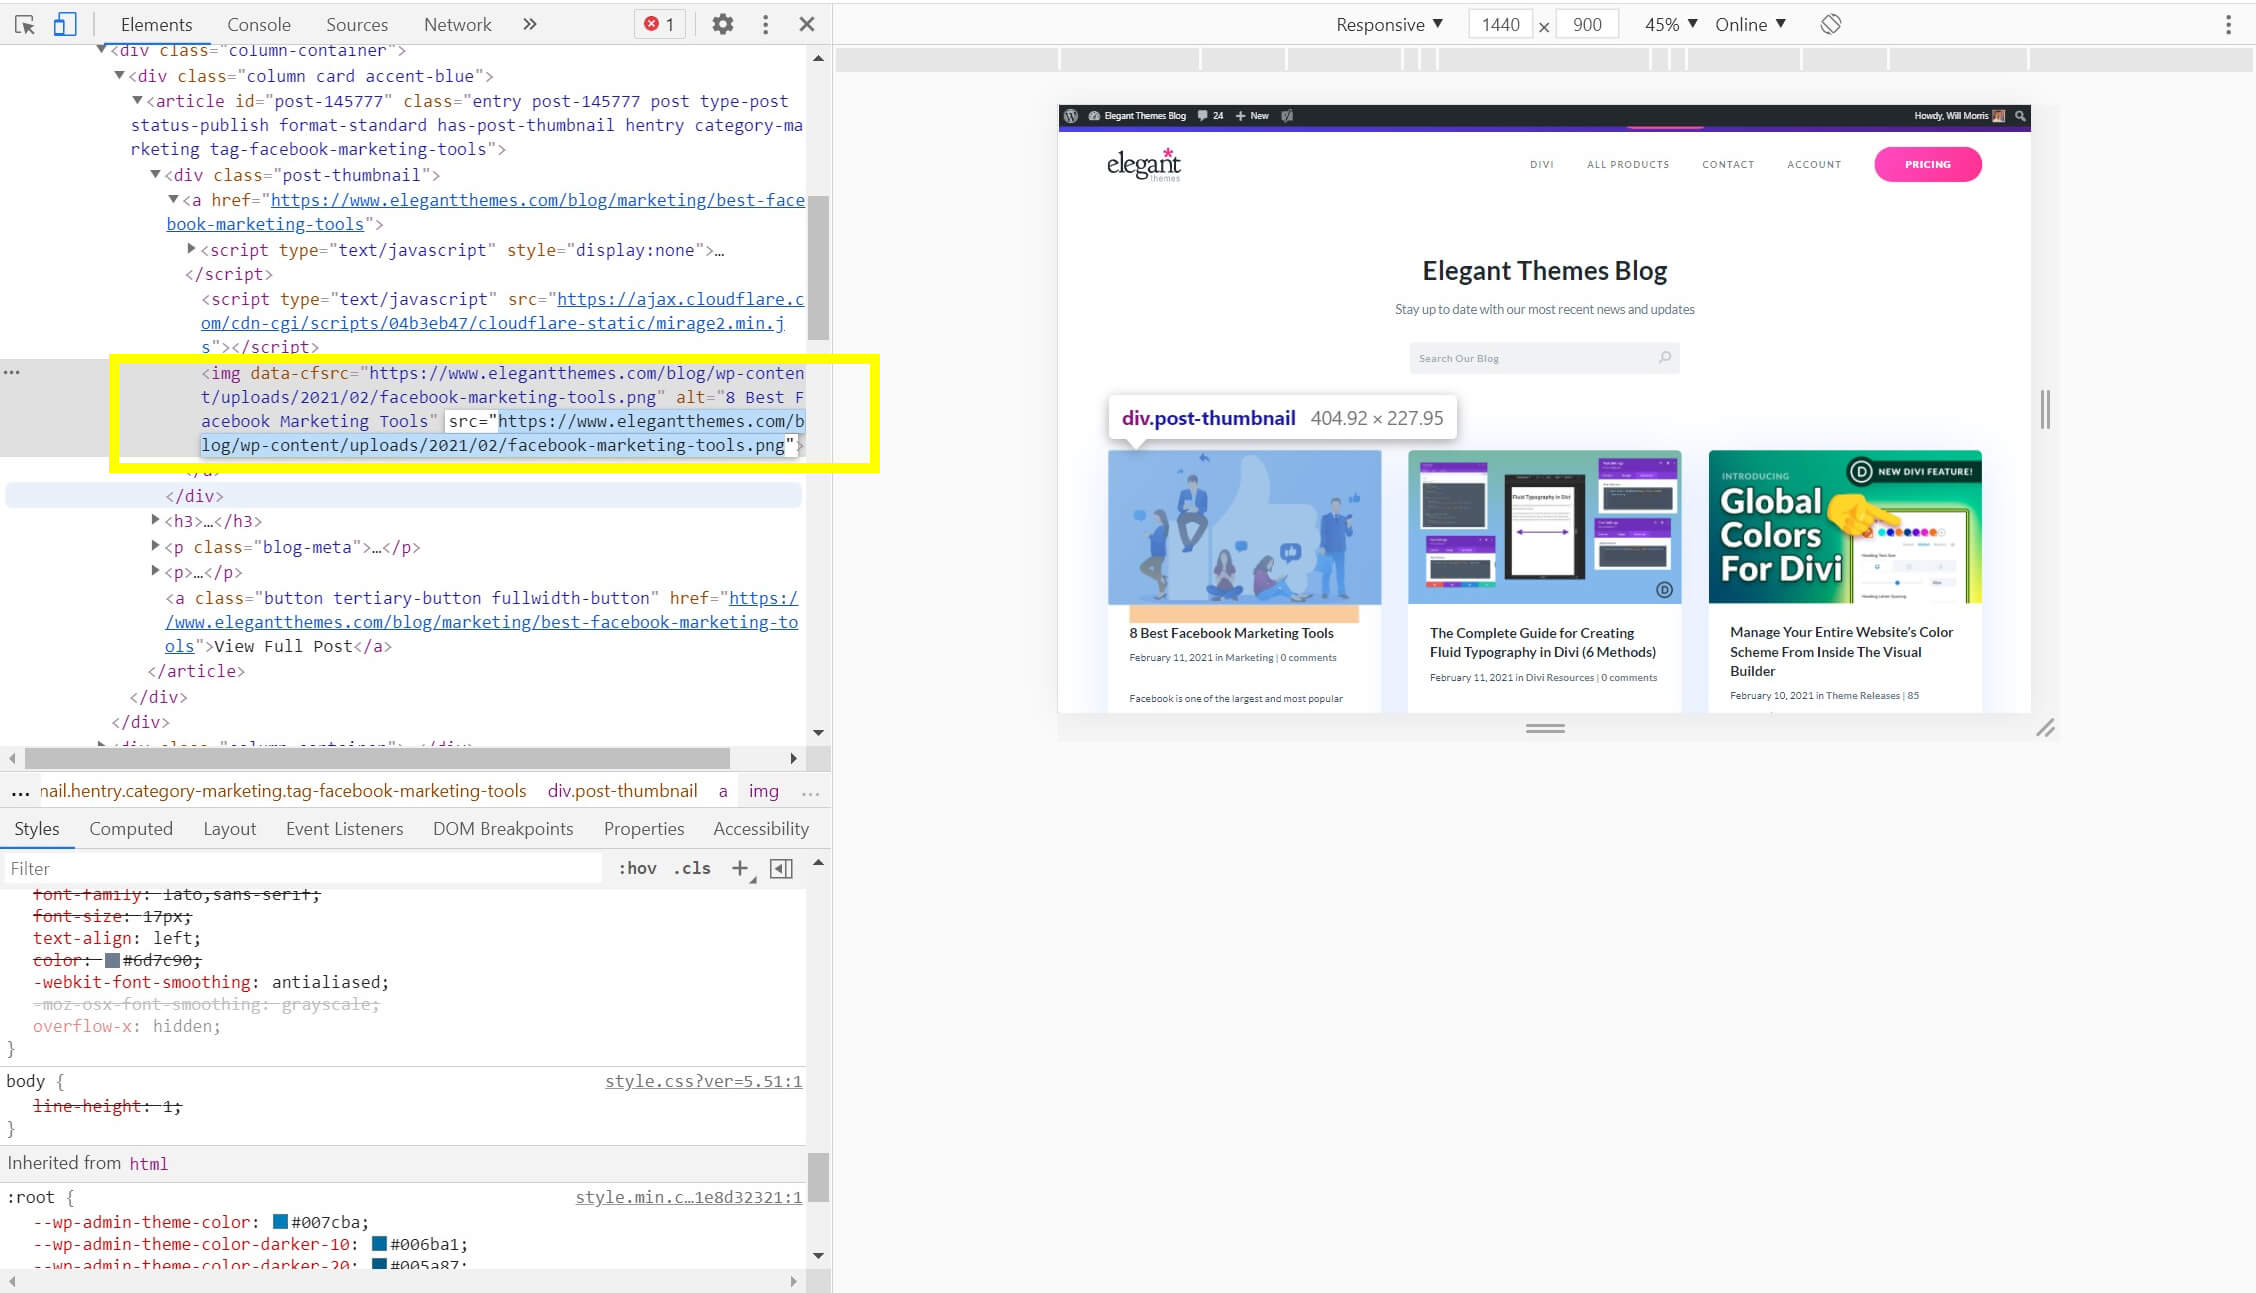
You can then paste in the URL of a different image to test it. If the image is in your WordPress Media Library, you can quickly find the URL in the attachment details:
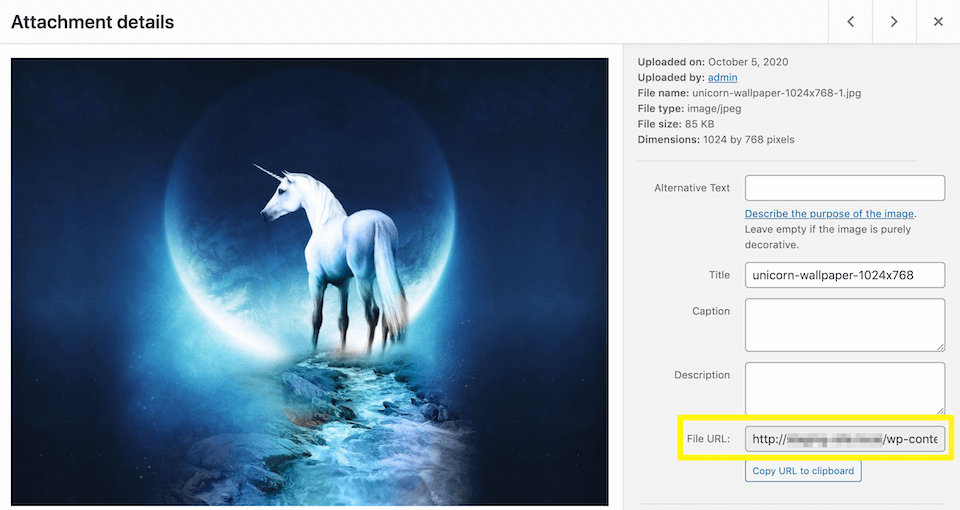
There’s even a handy button to copy the URL to your clipboard. Again, remember that any changes you make in the inspector are only temporary and only visible to you, so feel free to play around.
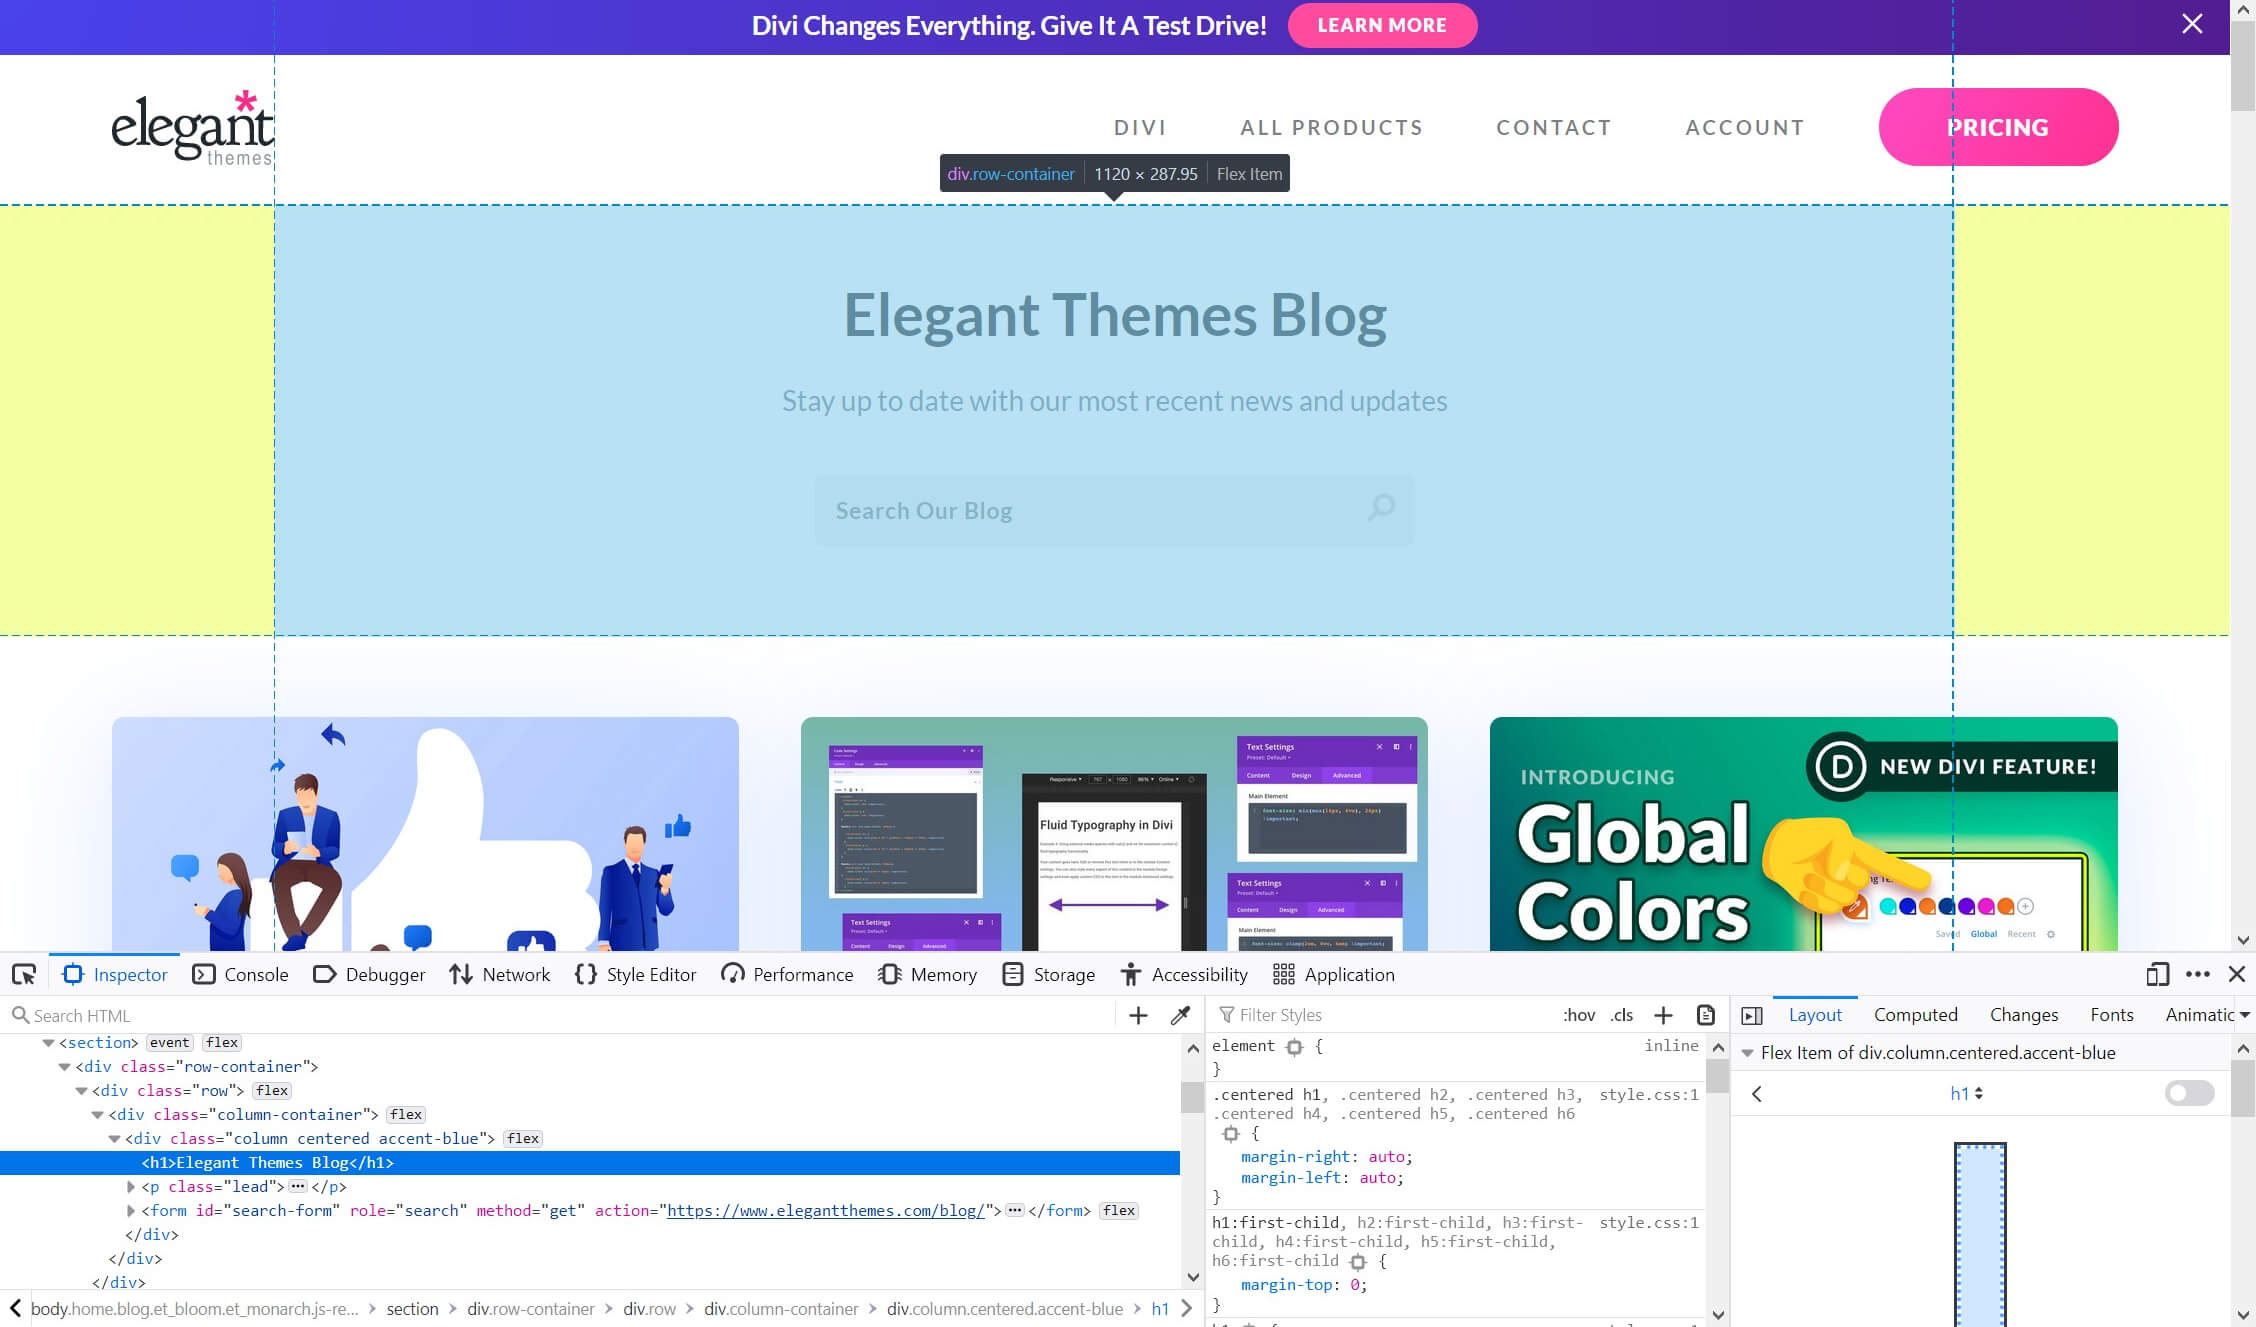
5. Test a Site Using Device Emulation
Finally, another useful feature of Inspect Element is the ability to emulate different screen sizes and even specific devices. This enables you to test a site’s responsiveness and see exactly how it will appear with various mobile form factors.
With the Inspector open, click on the icon that looks like a stacked phone and tablet:
This enables device emulation. Note that it may be enabled by default when you open the inspector. Resize the page’s preview using the handles around it, or click on the dropdowns at the top of the preview pane to choose various devices:
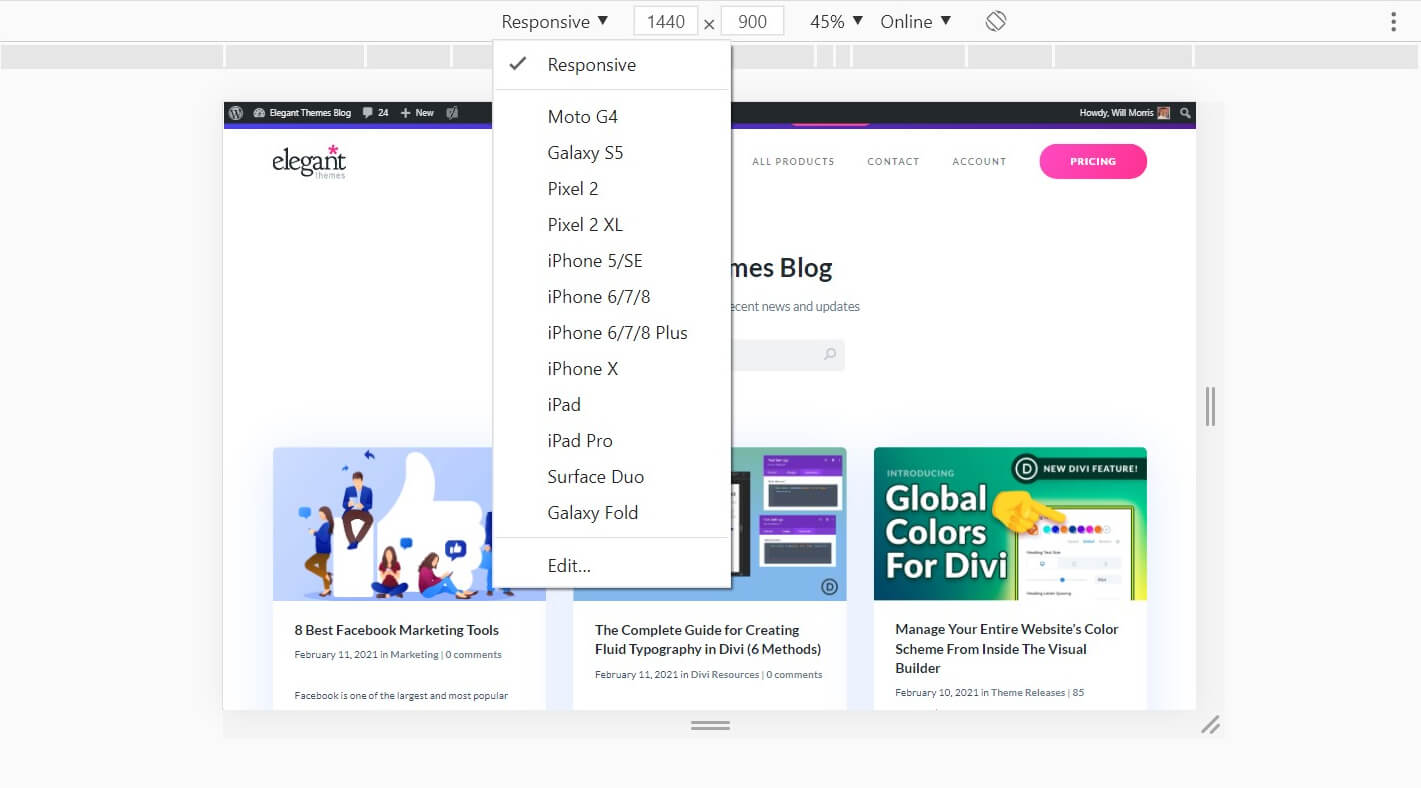
You can also enter a specific aspect ratio or even check how the page looks when the mobile device is rotated by clicking on the “rotate” icon at the top of the preview pane. To emulate various sensors, such as location and touch, click on the three-dot menu in the inspector pane and select More tools > Sensors.
Conclusion
Whether you’re new to web development or a seasoned professional, the Inspect Element tool is a powerful utility that should definitely be in your arsenal. It’s easy to access, almost universally available, and makes a variety of operations fast and easy.
In this article, we demonstrated how to access Inspect Element in Chrome, Firefox, and Safari. We also showed you how to use it to locate CSS classes, troubleshoot a website, temporarily change text and images, and emulate mobile devices. With this toolkit, you have everything you need to make Inspect Element a part of your workflow.
Do you have any questions about using Inspect Element? Let us know in the comments section below!
Featured Image via Kinjugraphics / shutterstock.com.


This can be a lot of fun for changing what webpages say and trolling your friends!!!