
Connection errors are bound to happen to everyone who uses the internet. At some point, the traffic slows to a crawl and the data just doesn’t go through. Whether that’s trying to submit a credit card number that just won’t go through, playing an online game where your commands have seconds of latency between button presses, or just a website that keeps crashing that you know should be up and running perfectly. While there isn’t always something you can do to fix it, knowing how to run a traceroute can absolutely relieve frustration and give you an idea of where the problems are and who to contact for a fix.
Subscribe To Our Youtube Channel
What is a Traceroute?
A traceroute is pretty much what it sounds like: you are tracing the route that data follows from Point A (usually your computer) to Point Z (the website or other destination service).
Internet traffic doesn’t go in a straight line. In no way does your request go directly to the website. The data will be routed through a number of different nodes and hubs, from proxy servers to CDNs. Because there are various nodes handling that data, the chances of data errors increase proportionately.
Running a traceroute will give you a lot of information about what is going on between these nodes so that you can more easily understand why your data has stalled out.
How to Run a Traceroute
The actual process of how to run a traceroute is pretty simple. It will differ slightly depending on what operating system you’re on, but the general idea is the same across the board. You will use the command prompt to actually run the traceroute, but don’t let that scare you away. It’s just a few keystrokes that are easily remembered and understood.
Running a Traceroute in Windows
To run a traceroute in Windows, you’re going to need to open up the command line or PowerShell. You can do so by pressing the Windows Key + R to open the Run window.
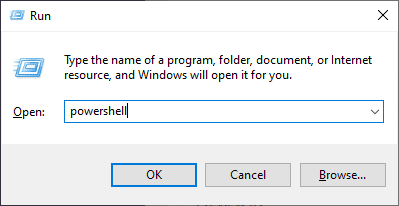
You can type in either cmd or powershell, and Windows will open the respective tool. Once it’s open, just type tracert elegantthemes.com (or whatever URL or IP you’re tracing).
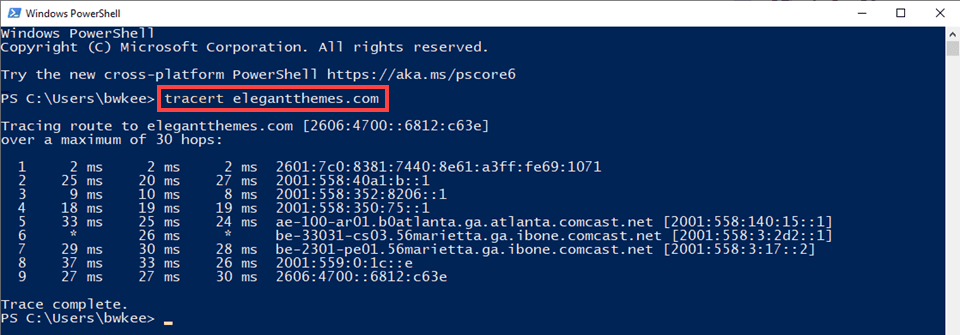
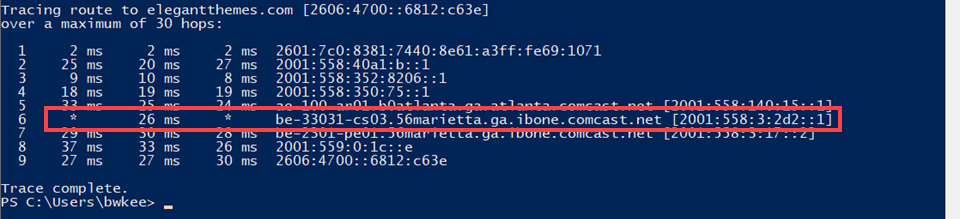
The data you’re given back can look like gobbledygook if you’re not used to it. We’ll explain below how to interpret it. But the basic info is the number of hops your data takes to get to its destination. In this case, 9. Then the speed at which the data took to get to that point and back to you (2 milliseconds to the first, then 27ms to the next, 8ms beyond that…and so on). And lastly, you see the actual locations of the machines that handle your data. This may be shown as either MAC address or IP address.
How to Run a Traceroute on Mac
On Mac, the process is very similar. You will open your Spotlight search and look for Terminal. You can also find this in your Utilities folder under Apps.
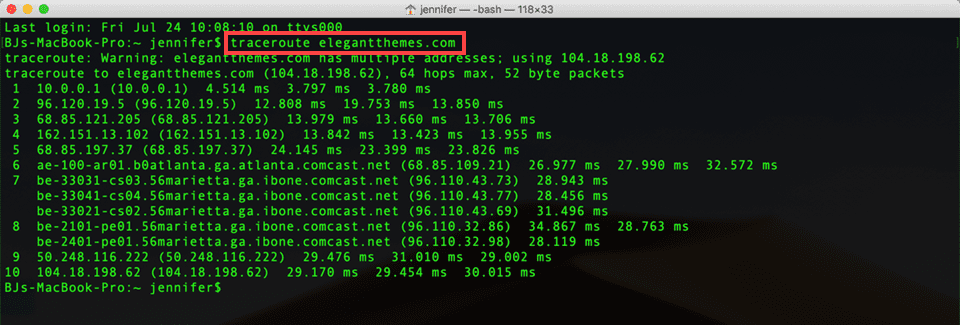
The command on Mac is different than on Windows, too. You’re going to run traceroute elegantthemes.com instead of tracert. The information you get will be roughly the same, however. In the Mac terminal, the information is delivered in the opposite order, and even when running to the same place, you get IP addresses instead of MAC addresses as on PC.
Note that on Linux, the command is the same because Mac and Linux are both based on UNIX. So you should just be able to open your terminal and run the traceroute command on a Linux installation, too.
Interpreting the Data
The data you get from a traceroute can be a little confusing. But it doesn’t have to be.
Hop Speeds
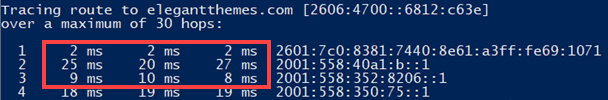
If you notice in the examples above, the traceroute gives three different times for each node that it traces. The reason why you might get one that says it took 29 milliseconds, 30 ms, and 28 ms is because the traceroute sent three separate packets of data to that node. It pings it three times and then checks the speed at which the packet returns.
Doing so lets you see if there are spikes or abnormalities between them that a single ping won’t catch. In general, you’ll see differences within 10 milliseconds. Maybe 20. If you start seeing differences 30 and above, something might be going on. And if you’re seeing differences in the hundreds, there is definitely an issue that you should check into with your network admin or internet service provider.
Also note that anything under 100 ms can generally be considered as instant. It’s very hard to perceive anything below 1/10th of a second, but when you’re approaching 300-500 milliseconds (one third to half a second), the delays become noticeable and add up to delays, stalls, or crashes.
However, this is all relative to your computer, so if you have data traveling from New York to a server in Tokyo, expect longer delays — 1500+ ms would not be uncommon on later hops.
Asterisks and Node Locations
You might sometimes, but not always, see an asterisk (*) in place of a ping speed in your traceroute.
Basically, this asterisk means that the data for that packet was stopped, denied, or lost. It might have timed out, too.
As you can see in the addresses above, the first 4 in the series are similar MAC addresses, which indicate they’re a part of a nearby network, if not your local network — computer, router, modem, etc.
Then the traffic moves into ISP territory (we know this by it being handled by comcast.net), and that’s where the asterisk appears. So if there were a connection issue that predicated this traceroute, you would now know to contact Comcast to troubleshoot it.
And the last set of numbers comes from your destination and their set up. It might pass through a CDN like Cloudflare, and if there’s an asterisk or high latency ping here, you would need to contact that website’s administrator to determine what is going on.
Online Tools
But if, perhaps, you want to know how to run a traceroute to a particular server, but not just from your own computer or location, KeyCDN has a really nifty traceroute tool that you can use.

What is very useful about this tool is that you get all of the same information from them, but from numerous locations across the globe, from London to Tokyo to San Francisco. Run in concert with local traceroutes, using a service or tool like this one can help diagnose precisely where the connection issues are coming from.
Wrapping Up
Knowing how to run a traceroute is one of the skills that anyone on the internet should have in their toolbox. It won’t be something you use on a daily basis. However, when there are connection issues to be diagnosed and worked through, being able to open up a command line or know where to find a tool can save hours or days of time tracking down particular trouble spots.
What kinds of trouble has knowing how to run a traceroute saved you from?
Article featured image by local_doctor / shutterstock.com


You have explained that there are MAC addresses seen in the output from the command. That is not correct these are IPv6 addresses. The normal trace route / tracers can only handle layer 3 addresses and not layer 2 addresses (MAC). There is a layer 2 version of the command but only on layer devices that have implemented these function like Cisco Catalyst switches.
Nice post on Traceroute, I often see it being mentioned and used within the infrastructure spectrum but not the web side. That nifty traceroute tool from KeyCdn is an excellent share, interesting to look at the hop times. Notice they also have a ping test tool which gives you the round trip time (RTT) for a site from a variety of locations. Thanks for the post
A lot of routers is also configured to not response on ping requests, so may produce false errors.
It is the most technical solution of the http errors that i have found on internet. Everything is explain in easy and understandable way. Thanks for sharing just a brief post.