

Google Analytics is one of the best tools you can use to understand how engaged your website audience is.
By looking at the data you can learn and identify problems and issues that prevent you from successfully engaging your audience.
You can also identify what helps you to improve user engagement.
To be able to do that you should know what the most important Google Analytics engagement metrics are and how to track them.
Bounce rate
Bounce rate is the percentage of visitors that bounce back (leave) from the first page they visit on your site without exploring it further.
The reasons for high bounce rate could be many – from people arriving on a wrong or unwanted page to web design, usability issues and too many distractions.
It’s important to state that according to Dan Zarrela, exit-intent popups don’t contribute to a higher bounce rate.
In all cases, a high bounce rate is a signal that there is something wrong with your website because your visitors don’t engage by exploring it further.
Bounce rate along with ‘time on site’ are part of dwell time, a metric that affects your search engine rankings.
So a high bounce rate and low time on your site decreases your SERP.
Average bounce rate per industry: KISSmetrics made a great infographic sharing the average bounce rate for different industries tracked with Google Analytics:
- Retail – 20 – 40%
- Landing pages – 70 – 90%
- Portals – 10 – 30%
- Service sites (self-service or FAQ site) – 10 – 30%
- Content sites – 40 – 60%
- Lead generation (service for sale) – 30 – 50%
So if your numbers are higher you know you have work to be done.
You should know that a high bounce rate is not always a bad thing. Sometimes visitors bounce back because this page gave them exactly what they wanted.
How to track Bounce rate with Google Analytics – to track this engagement metric, go to Google Analytics – Audience – Overview.
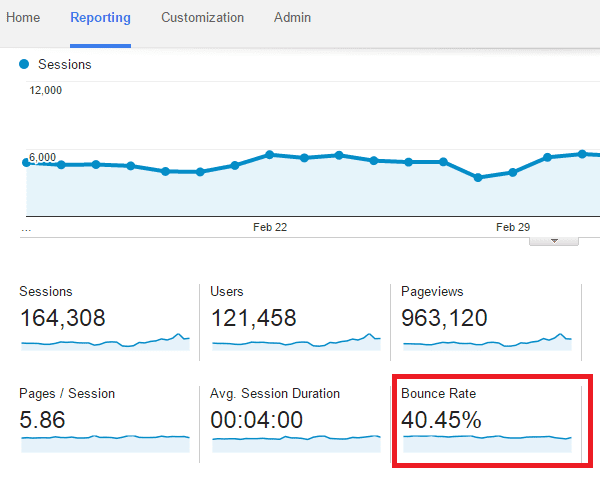
Image source: Google Analytics
If you want to check the bounce rate per traffic channel go to Acquisition -> All Traffic -> Channels.
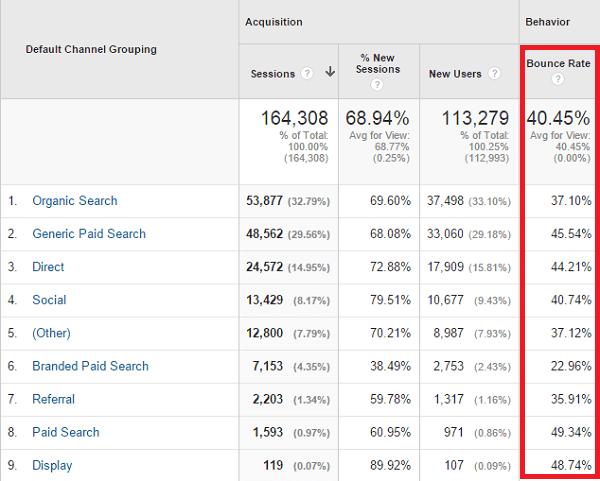
Image source: Google Analytics
That way you can see that traffic coming from “Paid search” (49.34%) has a much higher bounce rate than “organic search” (37.10%).
Then you can take action to find out why.
In case you want to check out your bounce rate by exact source go to Acquisition -> All Traffic -> Source/medium.
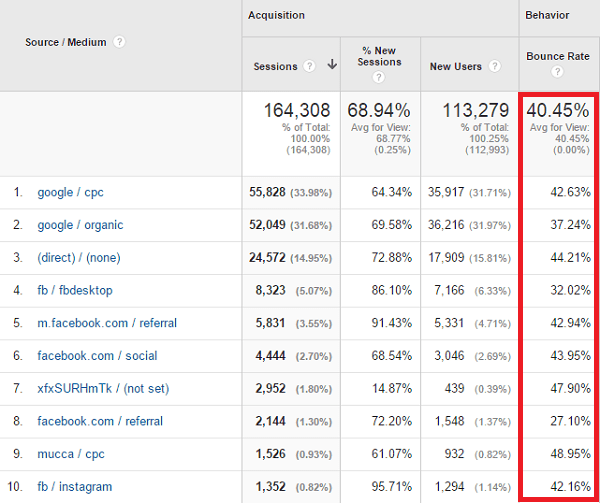
Image source: Google Analytics
Another way you can measure bounce rate is by landing page. That way you can see which ones are contributing to your high bounce rate so you can fix them.
Go to Behavior – > Behavior Flow -> Site Content -> Landing pages
Time on site
According to HubSpot, 55% of visitors spend 15 seconds or less on your site.
This points to a huge problem – if people don’t engage with your website, you won’t be able to sell them your goods or services.
That’s why it’s crucial to track this Google Analytics use engagement metric.
And when you find that people are spending too little time on your site you should use some strategies to increase it.
How to track time on site with Google Analytics – go to Audience -> Overview to see the avg. session duration for your website.
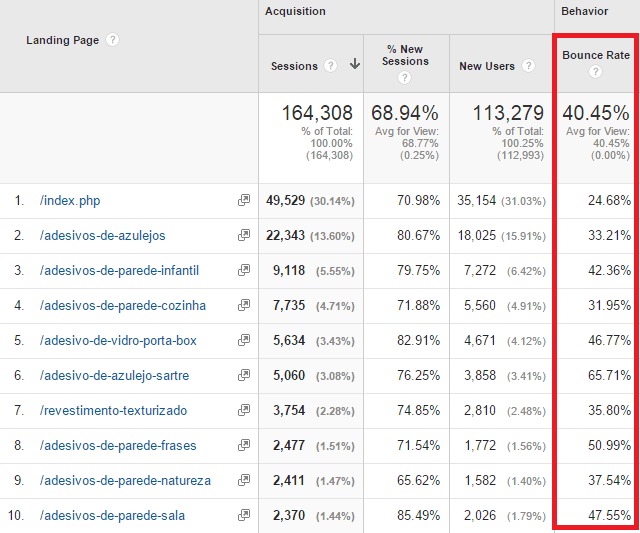
Image source: Google Analytics
To track time on site by channel go to Acquisition -> All Traffic -> Channels.
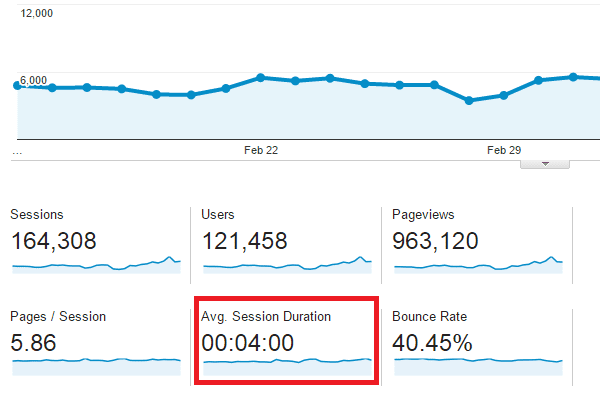
Image source: Google Analytics
That way you can see that user engagement from “branded paid search” spend much more time on your site than the ones from “generic paid search”.
To take things further you can check the time on the site for each traffic source.
To do that go to Acquisition -> All traffic -> Source/medium
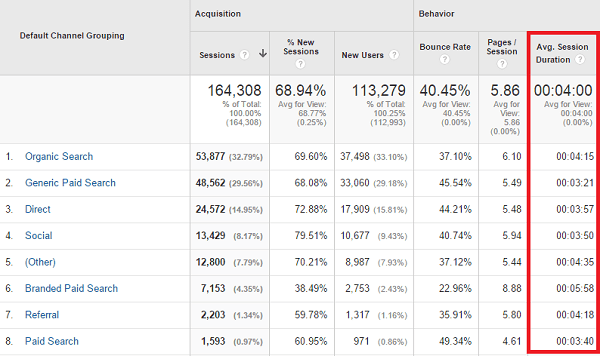
Image source: Google Analytics
Also, you should track time on site for each page of your site. That way you will know what page has your most engaging content and which posts lack engagement.
To see that go to Behavior -> Site Content -> All pages
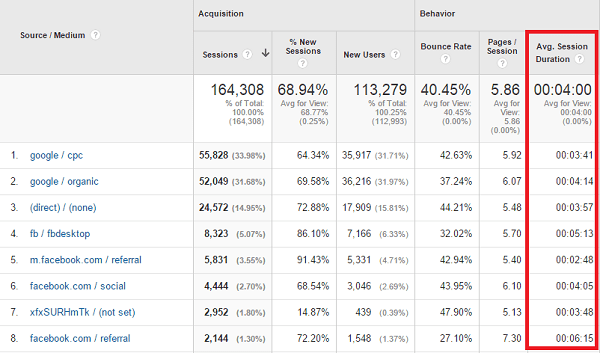
Image source: Google Analytics
When you have a blog you can use this data to see which blog posts engage your audience the most.
Average pages per visit
The average pages per visit will be a super important engagement metric to track for media websites.
The more pages people visit, the more ad impressions are generated which leads to higher revenue.
This Google Analytics engagement metric is important for other types of businesses as well – like eCommerce, SaaS and service-based businesses.
When people browse more pages from your site, they’re more likely to buy something.
If they only visit 1-2 pages per visit, this is a signal that you failed to engage them further.
How to track pages per visit – To view this Google Analytics user engagement metric to go Audience -> Overview. In the dashboard you will see Pages/Session.
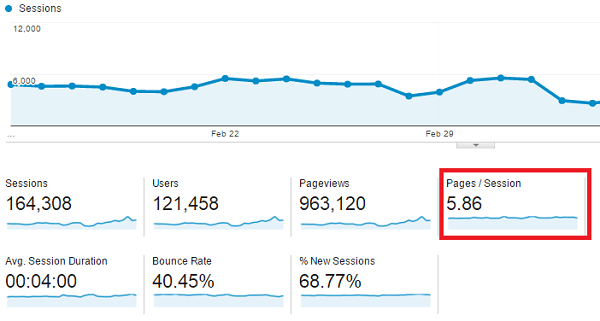
Image source: Google Analytics
We suggest you take a look at the pages per session for each channel to see how they affect your engagement.
To do that go to Acquisition -> All Traffic -> Channels
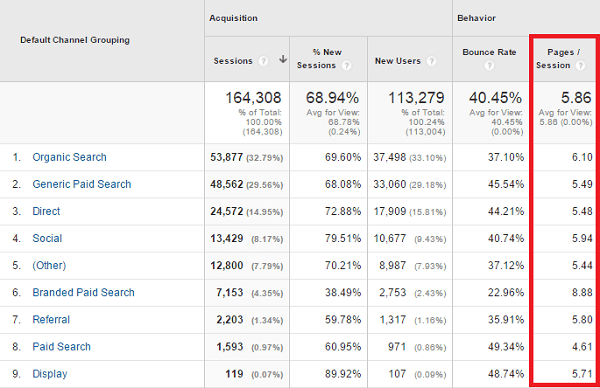
Image source: Google Analytics
For example: here you can see that the branded paid search traffic generated much higher pages/session ratio (8.88) than paid search (4.61).
To analyze this in more detail, take a look at the pages per session for all traffic sources.
To do that go to Acquisition -> All Traffic -> Source/medium
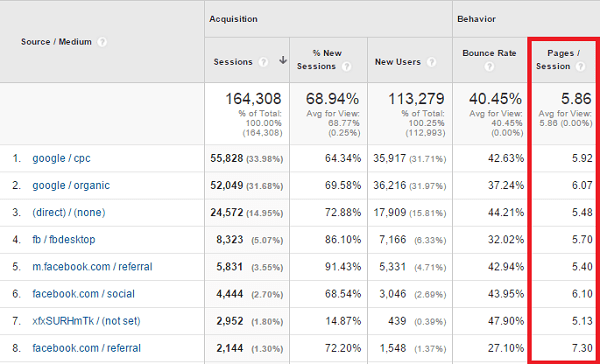
Image source: Google Analytics
Over here you can see that the referral traffic from Facebook has the biggest ratio for pages/session.
So if you seek more engagement you should invest in getting more referral traffic from Facebook.
Percentage of returning visitors
Returning visitors are the best visitors. They are the ones that have visited your website once, liked your content and come back again for more.
In this sense, they are more engaged around your brand. That’s why this is a really important user engagement metric you’d want to track with Google Analytics.
How to track percentage of returning visitors – to check that simply go to Audience – > Behavior -> New vs. Returning visitors.
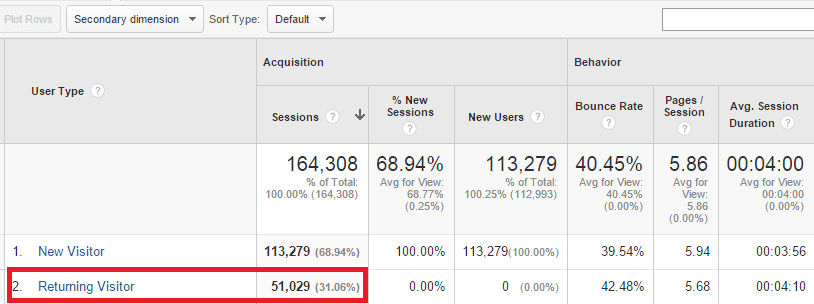
Image source: Google Analytics
In this case the percentage of returning visitors is 31.06%.
You can use this table to also compare other statistics between new and returning such as:
- Bounce rate
- Pages/session
- Avg. session duration times
- Conversion rate
- Revenue
That way you will see how much more money returning visitors are making you and how much you can afford to bring them back to your site.
Frequency of visits
Frequency of visits represents your user engagement similarly to new vs. returning visitors. However, here you have much more details.
You can see how many sessions were generated for a certain percentage of your audience.
How to track the frequency of visits – Simply go to Audience -> Behavior -> Frequency & Recency
The first thing that you will see is the count of sessions. This represents the frequency of visits for the average user.
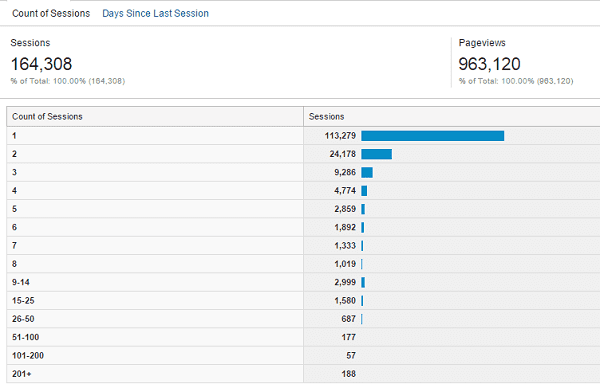
Image source: Google Analytics
In the table above you can see that most people visit the site only once (these are 113,279 sessions).
Only a small percentage of the visitors make 2 sessions (24,178 sessions) or more.
Days since last session
By looking at this user engagement metric in Google Analytics you can understand how often people visit your site.
How to track how many days have passed since the last session – Go to Audience -> Behavior -> Frequency & Recency and click on Days since last session.
Then you will see how many days have passed since most visitors’ last session.
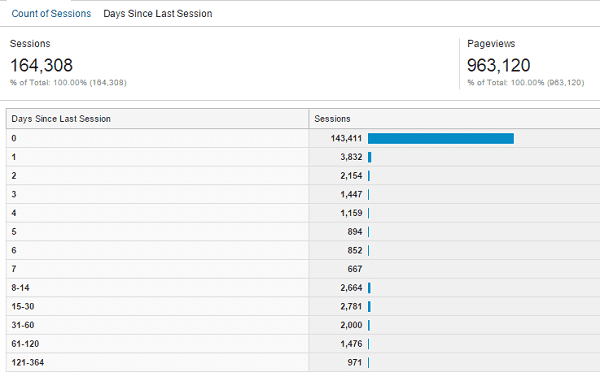
Image source: Google Analytics
Audience engagement rate
This engagement metric is similar to average time on site for your audience.
However, here you have many more details. You can see how long a certain percentage of your audience stayed on your site. (From 0-10 seconds to up to 1800 seconds)
How to track audience engagement rate – Simply go to Audience -> Behavior -> Engagement
By looking at Session duration you will see how long the majority of the visitors stayed on your site.
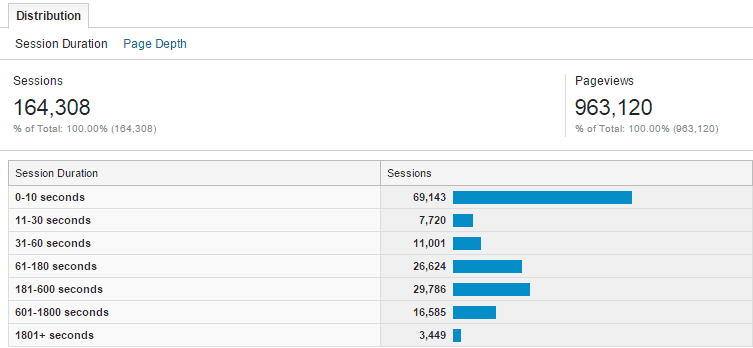
Image source: Google Analytics
In the table above, the majority spend between 0-10 seconds per session. Interestingly there are a lot of users who spend between 181-600 seconds on the site.
If you click on Path Depth you will manage to see how many pages most sessions generate.
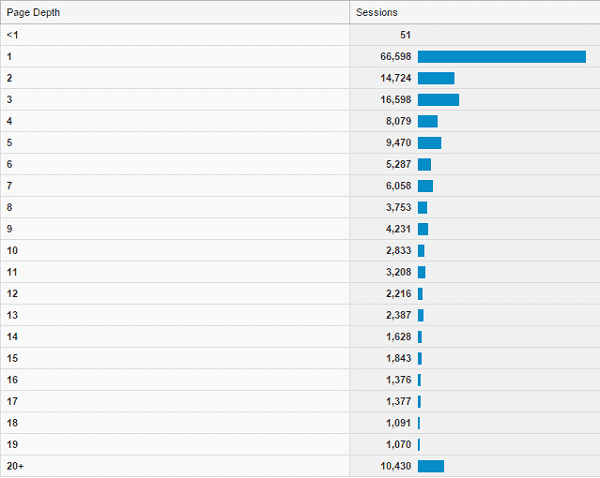
Image source: Google Analytics
Readers’ engagement
Justin Cutrioni came up with a way to track user engagement on his blog with a Google Analytics tracking code.
He wrote a blog post about how to implement this tracking code so everybody else can do it as well.
In summary you will have to use event tracking to understand how the reader is interacting with your page.
You start by defining the data that you want to see in Google Analytics.
Here we can group all reading activities into the category Reading.
In that category we will have 4 main actions:
- Article load
- Start reading
- Content bottom
- Page Bottom
How to implement event tracking to measure user engagement – Google Analytics will automatically track page URL and title so you don’t need to add it to the event.
So how do you know if people started to read your blog post or not?
You can place a special custom variable so if someone spends less than 60 seconds on your page, you send him into the Scanner bucket.
But if he stays on the page for more than 60 seconds, put him in your reader’s bucket.
Here’s the code that you need to use:
<script src=”//jsfiddle.net/justincutroni/74z8q/embed/” async=””></script>
Now let’s interpret the following variables:
- callBackTime – the time (in milliseconds) that the browser will wait before checking the scroll location.
- readerLocation – the distance (in pixels) that the visitor must scroll before classifying them as readers.
We also need to add another event for tracking that the article has loaded:
// Track the aticle load
if (!debugMode) {
_gaq.push(['_trackEvent', 'Reading', 'ArticleLoaded', '', , true]);
}
After that you can add this code to be able to check the location:
bottom = $(window).height() + $(window).scrollTop();
height = $(document).height();
And if the user starts scrolling we implement this event:
// If user starts to scroll send an event
if (bottom > readerLocation && !scroller) {
currentTime = new Date();
scrollStart = currentTime.getTime();
timeToScroll = Math.round((scrollStart - beginning) / 1000);
if (!debugMode) {
_gaq.push(['_trackEvent', 'Reading', 'StartReading', '', timeToScroll]);
} else {
alert('started reading ' + timeToScroll);
}
scroller = true;
}
To be able to check when someone reads your article you need to set up an event if the div that contains the article content has been reached.
// If user has hit the bottom of the content send an event
if (bottom >= $('.entry-content').scrollTop() + $('.entry-content').innerHeight() && !endContent) {
currentTime = new Date();
contentScrollEnd = currentTime.getTime();
timeToContentEnd = Math.round((contentScrollEnd - scrollStart) / 1000);
if (!debugMode) {</pre>
_gaq.push(['_trackEvent', 'Reading', 'ContentBottom', '', timeToContentEnd]);
} else {
alert('end content section '+timeToContentEnd);
}
endContent = true;
}
To track the time someone needs to read the bottom of the page add this event:
// If user has hit the bottom of page send an event
if (bottom >= height && !didComplete) {
currentTime = new Date();
end = currentTime.getTime();
totalTime = Math.round((end - scrollStart) / 1000);
if (!debugMode) {
if (totalTime < 60) {
_gaq.push(['_setCustomVar', 5, 'ReaderType', 'Scanner', 2]);
} else {
_gaq.push(['_setCustomVar', 5, 'ReaderType', 'Reader', 2]);
}
_gaq.push(['_trackEvent', 'Reading', 'PageBottom', '', totalTime]);
} else {
alert('bottom of page '+totalTime);
}
didComplete = true;
}
Finally, you need to add this code to check if the user reached the bottom of the page:
// Track the scrolling and track location
$(window).scroll(function() {
if (timer) {
clearTimeout(timer);
}
// Use a buffer so we don't call trackLocation too often.
timer = setTimeout(trackLocation, callBackTime);
});
How to read the data you collect for user engagement – after you have installed the code, you will need a few hours to start collecting data in Google Analytics.
Later on you can view it when you go to Behavior -> Events -> Top Events.
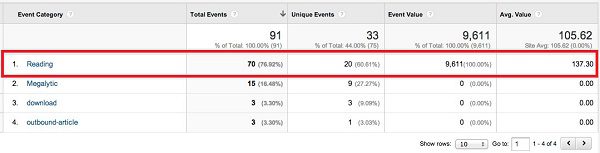
Image source: Megalytic
In the image above you should be able to see the event category Reading.
When you click on Reading you will see the 4 types of action events we track for it:
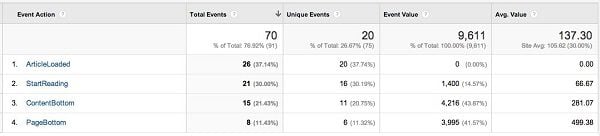
Image source: Google Analytics
- ArticleLoaded – tracking a viewed page
- StartReading – tracking reading of a page
- ContentBottom – tracking finishing reading a page
- PageBottom – tracking reaching the bottom of the page
To calculate the percentage of visitors who finish an article you need to use the following formula:
Percentage of Visitors who are Finishers = ContentBottom / ArticleLoaded
In this case, 15/26 = 57.7% finish reading.
To see the average time for a user to finish reading you need to look at the Avg. value for ContentBottom.
In this case this is 281.07 seconds = 4 minutes and 41 seconds.
In Conclusion
Tracking these Google Analytics user engagement metrics will help you understand your audience better.
You will learn how people interact with your website, you will identify problems and learn what you need to improve to engage your audience further.
There is absolutely no reason why you should not use Google Analytics to track this. Besides, it’s free.
Do you currently track the following user engagement metrics using Google analytics? Are there others you believe are important to be tracked? Let us know in the comments below.
Article thumbnail image by Kapralcev / shutterstock.com


Very helpful, Thank-you. I have a need to track if my users click on a specific button which opens a Bloom email form. Any idea how I could do that?
Thanks Dan for helping with tracking user engagement.
Hello, Dan!
A perfect guide for newbies likes me to learn Google Analytics. I go through the whole guide and learned a lot fro it. Helped me a lot to do analytics of my website step by step. Thank you, Dan for sharing such an excellent article. Keep doing a great job! ?
Very impressive!
Thanks for the tutorial.
That’s a great article with a lot of detailed guidance. Thanks, Dan.
Many thanks for the baby steps guide. I’ll work through these one at a time, in the same order.
I’ve lost track of the number of times I had entered GA, only to get lost and click away again.
Much appreciated.
Alan
Good read and I will definitely be coming back to this one to consider how to improve my own bounce rate, pages-per-visit and time spent on the site.
This is one of the most useful blogs that I have read focusing just on user engagement using google Analytics. Thanks for posting this!
Thank you for the wonderful guide 🙂
Great post, very informative. Have learned a lot from your site….
I enjoyed reading the post, although much of the detail was clarification rather than news. I found Thomas’s elaboration on Bounce particularly interesting. Need more of this….
I think that bounce rate must be the most mysterious factor to try and track. I run a service based business which relies heavily on internet traffic. My bounce rate has historically been in the 40-50% range which seems good typically. However I also run a forum on the site, so it’s impossible to tell if it’s just a few new forum members who’ve browsed a hundred threads over the course of a few weeks and thrown the whole thing off. I’ve pretty much written bounce rate off as irrelevant to me.
Hi Dan Virgillito, Great detailed information for Analytics.
Nice Post! The ability to qualify data is certainly getting more and more importance. Does anybody know how to track booking Portals which do not Link to your site? Would really appreciate your suggestion.Lollo
For the user engagement event tracking do you add the code to the head tag or the body tag?
In practice, the Google Analytics code will work regardless of where you put it on the page. We recommend inserting it in the section or after the opening tag if possible.
This is because the higher up it is inserted in your page source code, the sooner it will get executed after the user lands on your page. If you put your Analytics tracking code at the bottom of your code, it will be the last piece of script to get executed.
Sometimes, if the user navigates to another page before the page has finished loading, the tag may not have time to fire and the data you collect will be less accurate. That’s why the best practice is to put the tag towards the top of your page code.
Also – keep in mind that the tag is designed to work asynchronously, therefore, it will have no impact on your page load time
Very impressive!
This is great! I’m going to get my clients to read this as it’s such a pain when they ask you to explain how to read analytics all of the time.
The bounce rate is interesting too as a guide to how a site is performing, i’m going to use this as my bench mark, thanks 😉
There are several fundamental issues with this article, if you do not mind, I would like to correct them:
“Bounce rate is the percentage of visitors that bounce back (leave) from the first page they visit on your site without exploring it further.”
This is a common misconception about bounce rate however if you look at the official definition you can see that it has nothing to do with user engagement:
https://support.google.com/analytics/answer/1009409?hl=en
“Bounce Rate is the percentage of single-page sessions”
That is is pure definition and nothing more. By default, Google Analytics does not count the time spent on the last page of a session. In case the session only contains one page, this means that we can not see anything about this user. Thus: high bounce rate usually also means low time spent on the page. But this, by default, does not correlate with the real time spent on a page.
A high bounce rate on a single sales page means nothing. It does not give you data about whether users read your content or simply left the page without reading it.
A high bounce rate on a blog post does not mean your users do not read your content but blogs with high number of returning users usually only read the latest article and then leave the website.
A high bounce rate on a product page does not necessarily mean that users do not want to buy your product however they might be in the stage of discovery. If you are using tools like remarketing, you may get converted users even if they leave your page on their first visit.
A very low bounce rate on a site (like 5%) could also mean that you have measurement issues and you are for example counting visitors twice.
As you can see, bounce rate in general does not give you any answer. It is one simple metric: the number of one page sessions. Nothing more!
I am happy that you pointed users to the wonderful solution of Justin Cutroni, as this solution gives extra data for Google Analytics about engagement. And this extra data means that Google Analytics is now capable of counting more accurate time on page and it will not count a really engaged user as a bounce. But that needs extra measurements which this script can give you.
However you need to note for your readers that the original code of Justin Cutroni was being written several years ago. And since then, Universal Analytics arrived.
New Google Analytics account now give you a completely different tracking code snippet which is not compatible with the script of Cutroni. There are several rewrites of his code to Universal Analytics and Google Tag Manager, but in most cases, the code pasted into this article simply won’t work because it is outdated.
Not entirely true. What is written in the article is correct.
If you e.g. have a scroll event (50 %) on a page, it will mean that when a user trigger that event and then leaves that user will not count as a bounced sessions.
Exactly! I totally agree with @mikkel
Very good analytics training guide. A perfect guide for newbies. Soon do some post on Kissmetrics and vs Google analytics.
This article is so helpful. I have learned to use Google Analytics.