
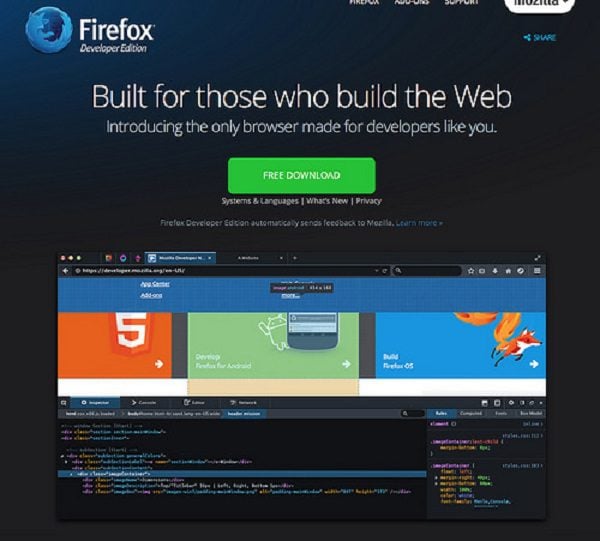
The Firefox Developer Edition is a special version of Firefox that has been tailor-made for developers. It features all of the latest Firefox features along with a number of specialist developer tools. Here I’ll provide a guide to its features so you know all there is to know about Firefox Developer Tools.
User Interface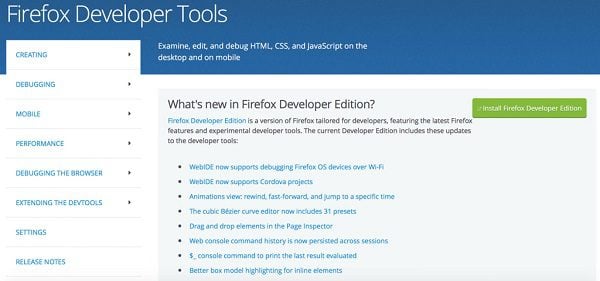
After installing the Firefox Developer Edition, you’ll notice that it looks slightly different to the standard Firefox toolbar. Firefox has certainly taken a more developer-centric approach in designing its toolbar, making it narrower in appearance and decorated with far more buttons by default.
The default theme for Firefox Developer Tools is dark, which is likely to be the result of user testing. However if you don’t like the dark theme, you can always switch the developer edition theme off by going to Menu > Customize.
Creating Tools
The Firefox Developer Edition comes with a number of creating tools, which are designed for those authoring websites and web apps. Below I’ve provided a rundown of the tools and their benefits so you don’t have to go searching for this information.
Scratchpad
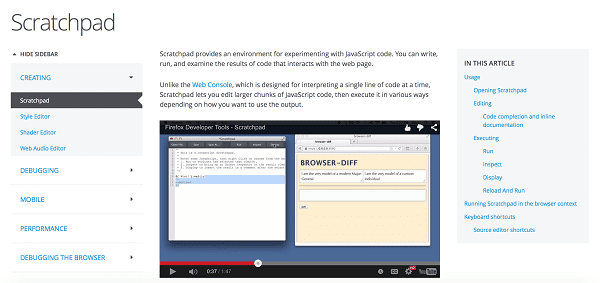
This tool gives web developers the opportunity to experiment with JavaScript code. In the environment provided by Scratchpad you can write, run, and examine the results of code that interacts with the current page.
To open Scratchpad simply press Shift F4 or go to the Web Developer menu and click on Scratchpad. This will open up the window where you can write your code. Once you’ve finished, click Execute > Run and the code will run in the current tab.
Style Editor
The Style Editor enables web developers to view and edit all the style sheets with the associated page. You’ll also be able to create new style sheets from scratch and apply them to a page, as well as import existing style sheets and apply them to the current page.
To open the Style Editor, go to the Web Developer menu and click on Style Editor. The Firefox Developer Toolbox will then appear at the bottom of the browser with the Style Editor ready to use.
Shader Editor
Using the Shader Editor in Firefox is simple. Developers can fully view and edit fragment shaders and the vertex as used by WebGL. And just quickly for those who don’t know, WebGL intelligently uses JavaScript (through an API) to render both 2D and 3D graphics directly through the Firefox browser, whilst not requiring the use of plugins.
In order to use the Shader Editor, there is a need to enable it first. To do this, go to Toolbox settings and then check the box next to ‘Shader Editor’. The Shader Editor will then display in the Firefox toolbar. Click on it and you’ll be able to open it.
Web Audio Editor
The Web Audio Editor API enables developers to create audio context. Developers will need to create audio nodes providing:
- Audio sources
- Nodes that perform transformations
- Notes representing the chosen destination for the audio stream.
The Web Audio Editor will examine the audio aspects of a page and provide a visual representation of it in a graph. This enables developers to examine functionality and operation and check that all of nodes connect properly. Developers can both edit and examine the AudioParam node properties, as well as other properties too.
Like the Shader Editor, the Web Audio Editor has to be enabled manually and is not a default setting. Enabling is easy: just go back to Developer Tool Settings then check the box next to ‘Web Audio.’ You’ll then see that there is an additional tab show within the Firefox Toolbox toolbar. Simply click on this tab and a page will be loaded from which you can construct an audio context.
Debugging Tools
Firefox’s debugging tools are designed for examining, exploring and debugging websites and web apps. Below I’ve outlined the key features of some of these tools and their benefits.
Page Inspector
The Page Inspector tool enables developers to inspect and make edits to the HTML and CSS coding of a web page. Using this tool, developers can investigate pages through the locally loaded version or via a remote target.
Opening the Page Inspector is easy. If you’ve got an element selected, you can simply right click on the element and then select ‘Inspect Element.’ Alternatively, you can go to the Web Developer Menu and then click on the Inspector option. The Page Inspector will then appear at the bottom of your browser.
Web Console
This tool logs all of the information associated with a web page, such as network requests, JavaScript, CSS, security errors and warnings, error warnings, and informational messages. It also enables you to interact with a web page by using JavaScript.
The Web Console was designed to replace the old Error Console, which was originally part of Firefox Developer Tools. Whereas the Error Console provided a huge list of errors from multiple pages, the Web Console will only ever show information associated with a specific web page, therefore making it more useful.
To open the Web Console go to the Web Developer submenu in the Firefox Menu and click on ‘Web Console.’ You can also use the shortcut Ctrl Shift K. The toolbox will then appear at the bottom of the browser with ‘Console’ activated.
Debugger
The Firefox Debugger tool gives web developers the opportunity to examine and modify your JavaScript code. It can also be used to identify bugs. Using the Debugger, you can debug code locally in Firefox, or remotely on a Firefox OS device or Firefox for Android.
To open the debugger, go to the Web Developer submenu in the main Firefox menu and click on ‘Debugger’. Alternatively you can press Ctrl Shift S and the toolbox will appear at the bottom of your browser with the Debugger activated and ready to use.
Network Monitor
The Network Monitor is designed to show you all of the different network requests made by Firefox, how long each request takes, and details of each request. Go to Web Developer Menu > Network to activate the tool. You’ll need to refresh the page to see the requests.
In the Network Monitor you’ll be able to view a timeline of the requests and filter the content by type. There is also a performance analysis tool, which you can use to see how long the browser takes to download different parts of your website. To run this tool, simply click the stopwatch icon in the toolbar at the bottom of the Network Monitor.
Storage Inspector
If you want to find out about the different types of storage a web page can use, then you’ll need to enable the Storage Inspector tool. As it currently stands, the Storage Inspector can be used to inspect Cookies, Local Storage, Session Storage, and IndexedDB.
The Storage Inspector provides a read-only view of storage. However Firefox has said that it’s working on developing the tool so that developers will be able to edit their storage contents in the future.
To open the Storage Inspector go to the Web Developer Submenu and click on Storage Inspector. Alternatively you can press Shift + F9 to use the keyboard shortcut.
Developer Toolbar
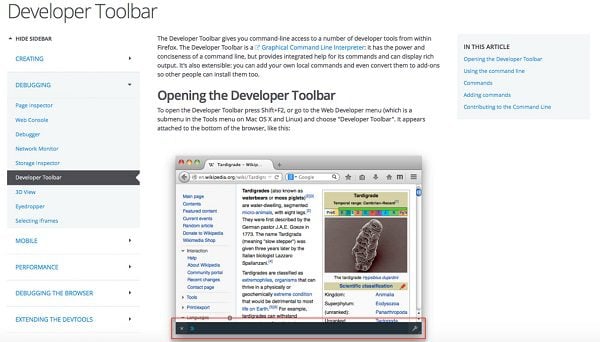
The Developer Toolbar is designed to give web developer command-line access to a number of the Firefox Developer Tools. In addition to using the commands set up by Firefox, which you can find here, you can also add your own commands using Scratchpad. These can be converted into add-ons so other people can use them too.
Open the Developer Toolbar by pressing Shift + F2. Alternatively you can go to the Web Developer Menu and click on Developer Toolbar.
Other Debugging Tools – 3D View, Eyedropper, iFrames
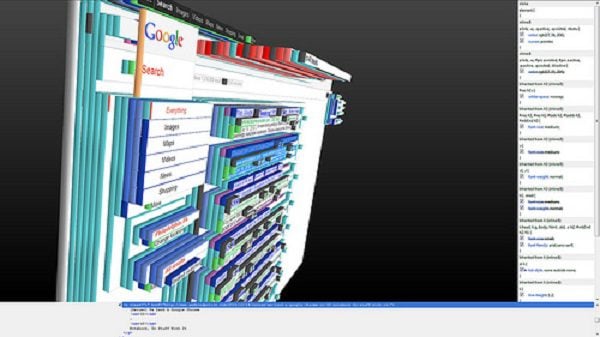
Other debugging tools included in the Firefox Developer Tools package include:
- 3D view: This gives you a 3D view of your nested blocks of HTML and content
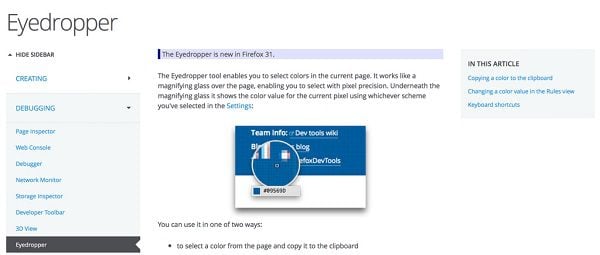
- Eye Dropper: This lets you select a particular color from the page and copy it to clipboard)
- Selecting iFrames: This allows you to point your developer tools at specific iFrames within a document.
Mobile Tools
In addition to the Firefox creating and debugging tools, there are also a number of mobile tools that developers can make use of for mobile developments. I’ll go through these in full below.
App Manager
This tool allows developers to test, deploy, and debug HTML5 apps on Firefox OS devices. It also acts as a simulator so testing can be carried out directly from the Firefox desktop browser.
The App Manager is delivered with an App panel, where developers can manage local apps and apps hosted externally; a Device panel, which provides information about a connected device such as its OS version and the apps installed; and Toolboxes, which are a set of Firefox Developer Tools that can be used on the running app.
WebIDE
This mobile tool enables developers to create, edit, execute, and debug their web apps through the Firefox OS Simulator or via a Firefox OS device. You can use it for connecting to the Firefox Developer Tools with other browsers such as Firefox for Android and Chrome for Android.
Other Mobile Tools
Other mobile tools include:
- Remote Debugging for Firefox for Android
- Firefox OS Simulator: This simulates a Firefox OS device but runs on desktop
- Responsive Design View: This enables you to view how your website or web app looks on different devices with different screen sizes.
Performance Tools
Performance is critical in web development, which is why Firefox provides web developers with a number of tools that can be used to diagnose and fix any performance problems with its websites and web apps.
Performance Tool
The Performance tool replaced Firefox’s original JavaScript sampling profiler. It still contains an updated version of the sampling profile; however it also has a frame rate timeline. More features are expected in the future.
The Performance tool can be used to create, analyze, and sample profiles.
JavaScript Profiler
The JavaScript Profiler is designed to help developers find issues in their JavaScript code. It does this by sampling the current JavaScript call stack and providing statistics about it.
Paint Flashing Tool
This tool will highlight the part of your webpage that the browser needs to repaint in response to an input. It enables web developers to figure out whether their website is making the browser repaint more than it needs to. Remember repaints can have a negative impact on your performance, so it’s a good idea to use this tool to eliminate unnecessary repaints and improve your website’s performance.
Separate Developer Profile
Having to switch between versions of Firefox would be a real pain. The good news is that Firefox Developer Edition uses an entirely separate profile to other versions of Firefox that you have installed.
Developer Release Notes
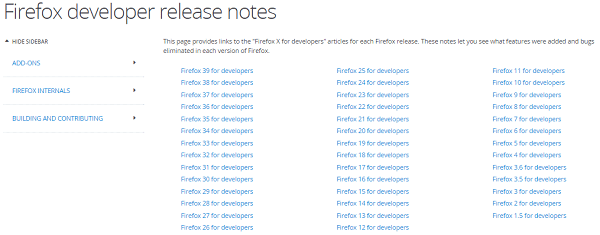
Developers wishing to read the notes relating to the current and any historic Firefox Developer Edition releases can do this simply by visiting this link.
Wrapping Up
If you are a new or experienced web developer, you’ll greatly benefit from making use of the detailed and varied Firefox Developer Tools. From creating code to debugging HTML, the tools allow you to carry out a wide range of actions that are required to develop a website or web app. The mobile tools are also extremely useful, especially for those looking to create responsive websites in order to benefit from the latest (21st April 2015) Google algorithm update.
For more information about the Firefox Developer Tools, head on over to the Mozilla Developer website and join the developer community. The Firefox Developer Edition is free to download and use.


I’ve started using these tools to play around with live code. By far the most annoying thing though is if I mistakenly click a link or somehow reload the page with the developer tools open, everything I’ve modified is immediately gone. Any solution for this?
Really firefox developer edition totally different from that of standard one.
AFter comparing it with the chrome we can easily find out a lot of interesting features in that.
thanks for sharing the latest info.
I am using chrome from so many years, but firefox can be also use as a developer tools. thanks for sharing
I could not find the 3D View.
Mozilla’s documentation says: 3D View is not included in the toolbar by default, but you can add them in the settings.
… but there is no 3D View option in settings.
All other options are there except 3D View.
Is there under another name?
Have they moved somewhere else?
Have they removed it completely?
The 3D view was removed from multi-process Firefox as it is a lot of work to get it working in a multi-process environment… you can still use it in a single process (non-E10S) window.
Of course we will fix it in the future.
Thanks, Brenda, for a good article. I’ve been using Chrome Inspecter & development tools… will check out Firefox.
I had a little trouble following this article. It starts off “after installing” but wasn’t clear about the installation process — I had to do a Google search then install. Was a little confused since I have the regular Firefox and have developer tools that I access by right click and select “Inspect Element”. So wasn’t sure if this article was about something different or about tools I already had on my standard Firefox browser.
Then I couldn’t figure out how you got your first screen shot with “Firefox Developer Tools” as header. I installed The Developer Edition after my Google search – but the home page is a search bar. Never did find the page like your screen shot.
Also couldn’t figure out how to get the toolbar on the left side like your screen shots. Which is OK because I’m used to it being on the bottom. I could get it to go on the right side. I also didn’t have same sidebar items as you. (I’m on PC but that shouldn’t matter) All the inconsistencies had me confused. But I’m not the sharpest tool in the shed. 🙂
Anyway – good article. At least got me thinking about Firefox again.
Great Article thanks for sharing information about firefox developer tools.
Finally, an article related directly to what we do xD
Is this dev version something similar to Chrome Canary?
https://www.google.com/chrome/browser/canary.html
Firefox Nightly was comparable to Chrome Canary in that it is a nightly snapshot of Firefox.
In the developer edition we have enabled a bunch of options and tools that are just for developers. This means that you can e.g. open a browser toolbox to view or edit the markup, CSS and JavaScript that comprise the browser itself.
Of course, there are a bunch of tools that web developers in general will find useful so we enable those on by default.
I didn’t go on trying out its features, because I couldn’t change the values with wheel scrolling, like i do on Chrome..!
I used Firefox Developer since the first version, i am no longer using it for some really stupid but important (at the same time) problem.
The way it renders websites, it’s extremely slow, on forums using xenforo and complex themes, it’s almost imposible to rescale the windows without having Firefox Dev hangin on me !
It’s being great for developing though, really nice interface, clear work space, some minor complains, like @media queries not properly showing when you mark them but about the worst problem is the slow rendering, Chrome had the same problem but it fixed it with a nice rescaling on the external window, firefox did not and could hang if the website is complex enough.
Great article, thanks!
Holy crap, how I did not about this Firefox version? Some of the tools seem awesome. To many to mention, but the 3D view will be the first thing I will check…
Thanks for sharing, this is probably the most useful blog entry Elegant Themes has ever written.
A million thanks!