

Google Analytics is a free web analytics tool that lets you track various site statistics, such as how much traffic your site receives, where that traffic comes from and even how long people stay on your site before leaving. If you’d like to learn more about this tool and what it can do, check out our Google Analytics introductory post by Kevin Muldoon.
Kevin’s post teaches you the basics of everything Google Analytics has to offer. Be sure to check it out if you’re still new to tracking site statistics or new to Google Analytics in general. With that info fresh in your mind, we can move on to the subject at hand today. This post is all about creating custom dashboards inside of Google Analytics.
A dashboard is essentially a child tool of Google Analytics. It lets you view several different metrics and statistics about your site in one location in a way that’s visually appealing and easy to read at a single glance.
Every account comes with a basic dashboard called My Dashboard. This dashboard is filled with most of the metrics you’ll use for your site on a weekly basis, but there are plenty of reasons to create custom dashboards, too. Maybe you want one dedicated to nothing but your site’s bounce rate and another one that monitors your user’s behavior?
Custom dashboards allow you to track these different types of statistics so you can gain a better understanding of what’s working on your site, what you should eliminate, and what you can improve upon. Let’s start with how to create a custom dashboard in Google Analytics.
Create a Custom Google Analytics Dashboard
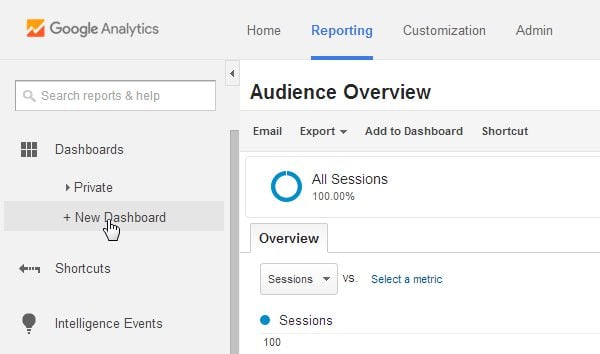
Head to the Reporting section of your Google Analytics account, and look for the Dashboards section in the menu on the left-hand side of the screen. Click the New Dashboard button.
Let’s start off by creating a Bounce Rate dashboard. Make sure Blank Canvas is selected, and name the dashboard “Bounce Rate.” Click Create Dashboard when you’re ready.
When you create a new dashboard, you’re prompted to add a widget to it right away. Let’s take a moment to go over what each widget does:
- Metric. This widget displays as a single number, with or without decimals depending on the metric.
- Timeline. This widget uses a line graph to display how a metric changes over time. It can even be used to compare two metrics against each other, hence the double-line graphic in the widget’s icon.
- Geomap. This widget displays a plain white atlas of the world and uses various shades of blue to show which country each metric occurs in.
- Table. This widget displays a simple table that can have as many as 2 columns and 10 rows.
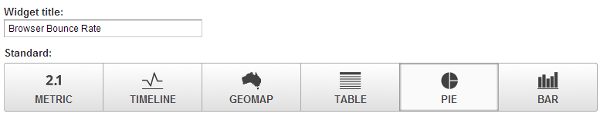
- Pie. This widget displays a simple pie chart that can have as many as 6 slices.
- Bar. This widget displays a typical bar graph that can have as many as 9 bars and several optional features, such as which axis to place titles on.
You’ll also notice there are two types of widgets: standard and real-time. Standard widgets display dimensions of metrics as they change over time and are entirely dependent on the date range you select in the upper right-hand corner of the page. The real-time widgets display live dimensions of metrics as they happen, such as how many visitors are currently on your site.
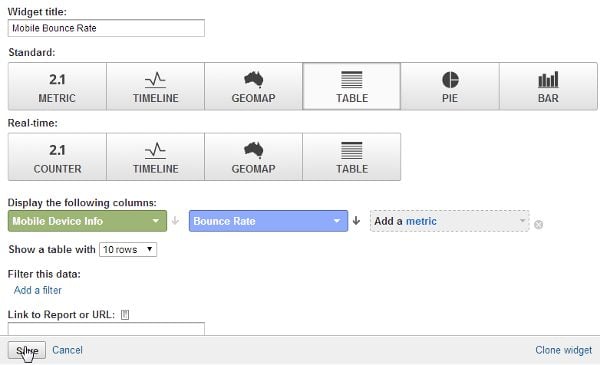
Getting back to our widget, name the widget “Browser Bounce Rate,” and click the Pie selection.
Select the Bounce Rate metric for the Create a Pie Chart Showing selection, and select Browser for the Grouped By selection. Click Save once you’re done.
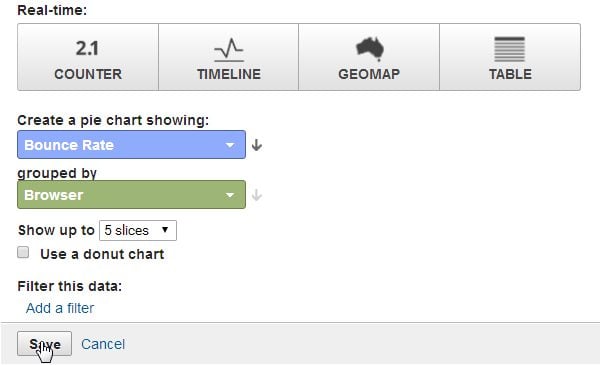
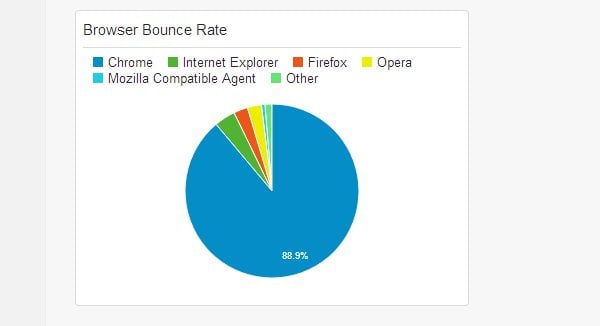
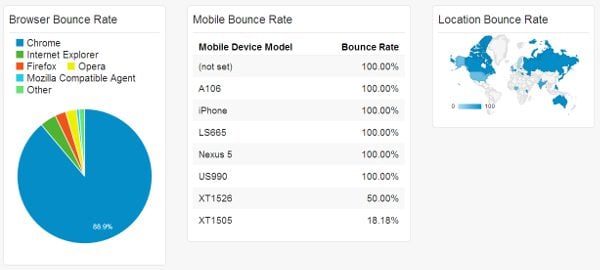
This puts a Bounce Rate metric on your dashboard that tells you which browser your site’s bounces are coming from.
Click Add Widget, and name the new widget “Mobile Bounce Rate.” Select a Table or Bar widget. The Pie chart only shows as many as 6 slices. The Table and Bar graphs allow us to go as high as 10. Select Bounce Rate as a metric and Mobile Device Info as a dimension. Click Save when you’re done.
Now you can see which mobile devices your bounces are coming from. I can create another to track where my site’s bounce rates are coming from based on location using the Geomap selection.
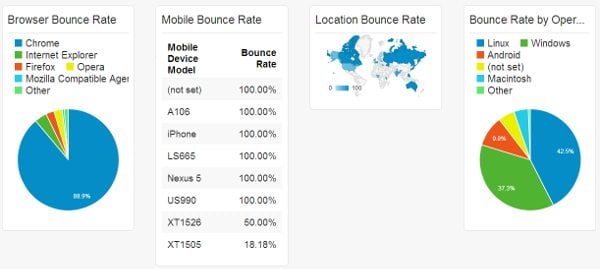
Dashboards come with a drag-and-drop feature, so you can rearrange your widgets in a way that should be familiar to you if you’ve ever rearranged the widgets on your WordPress dashboard. You can even click the Customize Dashboard button toward the upper right-hand corner and select a different layout option. I’d do this if I had a fourth widget, one that measured bounce rate by operating system, or if I wanted to stack widgets in different columns.
Why Create Custom Dashboards for Specific Metrics?
The Starter Dashboard, or My Dashboard, contains all of the basic metrics you should be monitoring on your website. These include the number of new users who have visited your site, the total number of users who have visited your site, your bounce rate, and where users are visiting your site from, such as by location and browser.
When you dig deeper into these metrics, you can get a better understanding of what’s causing their existence. For example, with our Bounce Rate dashboard, we can determine if site speed or lack of a mobile-friendly website is causing certain people to turn away the second they land on our site.
Websites work differently on different browsers, so using these metrics can help us determine if coding errors are causing people to turn away. There’s also the unfortunate reality that not everyone in the world has access to high Internet speeds. The Geomap widget can help you determine if your site loads too slowly for people in certain parts of the world.
There are too many metrics to name, but you can even get as deep as measuring bounce rate based on how many people landed on and stayed on your landing page.
SEO Dashboard
This dashboard gives you an overview of your site’s SEO efforts. This page can use any or all of the following widgets:
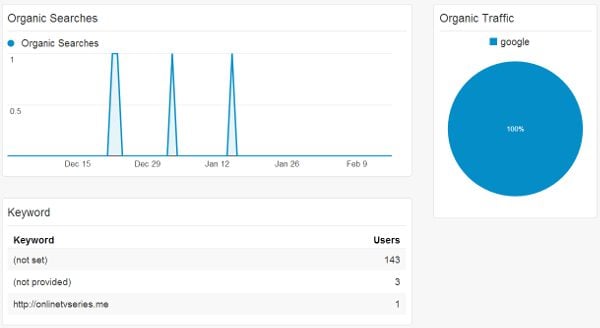
- Organic Traffic- Timeline. This widget uses the Organic Searches metric to display the number of organic searches your site receives.
- Organic Traffic- Pie Chart. This widget uses the Organic Searches metric and the Source dimension to display the source(s) of your organic traffic, such as Google or Bing.
- Landing Page- Table. This widget uses the Landing Page dimension and the Avg. Time on Page and Bounce Rate metrics to display your site’s top landing pages as well as how much time users spend on those pages.
- Main Source- Pie Chart. This widget uses the Users metric and the Source dimension to display the top six sources of traffic your site receives.
- Keywords- Table. This widget uses the Keyword dimension and the Users metric to display which keywords refer users to your site the most as well as how many users are referred to your site for each keyword.
- Specific Source- Table. This widget uses the Source / Medium dimension and the Users widget to display the specific pages the majority of your traffic comes from.
- Average Page Load Times- Bar Graph. This widget uses the Avg. Page Load Time (sec) as a main metric. Dimension can be anything you want it to be, but I chose Month of Year. Some people choose Page or Page Title or other specific dimensions.
User Behavior Dashboard
This dashboard gives you an overview of how users interact with your site and which pieces of content new users see the most. Here are a few suggestions:
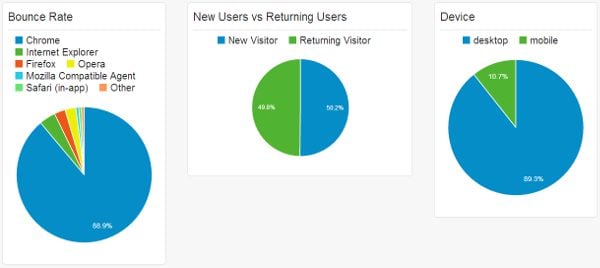
- New Users vs Returning Users- Pie Chart widget using the Sessions metric and the User Type dimension to display which percentage of your visitors are new and which percentage are returning.
- Bounce Rate- Pie Chart widget using the Bounce Rate metric and the Browser dimension to see which browsers are bringing the most bounce rates. As we seen from our example, this can also be used with devices and location.
- Device- Pie Chart widget using the Sessions metric and the Device Category dimension to display which percentage of your visitors are using desktops and which percentage are using mobile devices. This can help you determine how mobile-friendly your site should be.
- Most Popular Content- Table widget using the Page Title dimension and the Pageviews and Avg. Time on Page metrics to determine which pages are most popular on your site as well as how much time users are spending on them.
Technical Data Dashboard
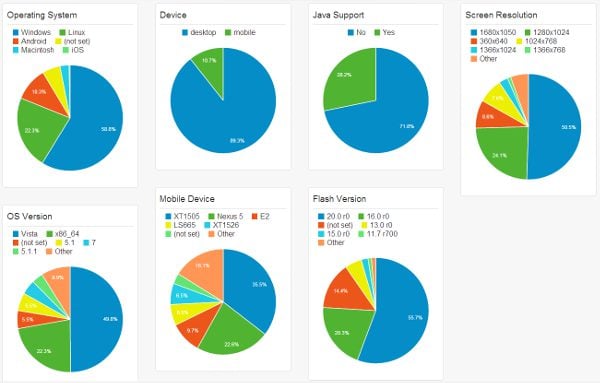
This is a dashboard for web designers. Using a few different dimensions, we can determine which types of devices people are using to browse our sites, which can help us optimize them better for our users.
All of the widgets in this dashboard use the Pie Chart widget and the Sessions metric. The dimensions are as follows:
- Operating System
- Operating System Version
- Device Category
- Mobile Device Model
- Java Support
- Flash Version
- Screen Resolution
Import Pre-Made Dashboards from Gallery
When you create a new dashboard, you’ll see the option Import from Gallery. Clicking this selection takes you to a gallery filled with user-generated dashboards other Google Analytics users have created and shared with the rest of the community. It’s a great place to find new dashboards if you don’t feel up to creating one yourself or don’t feel the need to get too technical with things.
Final Thoughts
Google Analytics is a powerful tool on its own, but the use of custom dashboards can greatly reduce the amount of time you spend sifting through all of the information it provides. You’ll also gain a better understanding of how your site is performing in terms of SEO, page speed, user engagement, and other metrics.
What types of widgets are you using in your dashboards? Let us know in the comments below!
Article thumbnail image by TCmakephoto / shutterstock.com


This is the article I was looking for, so thank you for helping. Could you please tell me what software you use to run your incredibly fast website? I also want to create a simple website for my business, but I need help with the domain and hosting. Asphostportal reportedly has a stellar reputation. Are there any other choices available, and if so, what would you suggest?
Thank you for this post! I haven’t set up any dashboards for my Google Analytics yet but I will definitely try this.
Is there any way to add comments to the dashboards? We are trying to set them up for our users but want to add comments to help guide them. So far we are recreating all these dashboards in PPT… crazy…
Thanks for this!
A thing I am missing is how to block bots. When I look at my stats for my new site (I have not even begun advertising it) the bounce rate is close to 100% as 99.9% of visits are from bot sites trying to sell me crap. It would be so nice if Google would add a right click and remove.
So if you have a guide to this then it would be much appreciated:)
Thanks
Chris
Hey, Lyn! Thanks for writing up this explanation. I’m insane about overviews in a visual way as a Web Designer, so this was awesome. Finally, after years, (in fact), I got 4 new dashboards set up! 🙂
Thanks.
Thanks for this post Lyn! ?
The timing has been perfect for some client work and I never knew some of these features existed…awesome!!
I’ve been meaning to do this for ages! This has just given me a good reason to do it now 🙂
Didn’t know Analytics had such a feature. Thanks a lot Lyn.
Thank you for this post! I haven’t set up any dashboards for my Google Analytics yet but I will definitely try this.
If you have two websites can you set up two dashboards in google analytics or can you run two sites off one dashboard? Good article. Thank you.
I don’t believe that is possible with Google Analytics by itself. However, there are third party apps that will combine more than one website tracked by Google Analytics into a single dashboard.
Thanks a million for all these fantastic posts you write. For a newbie like me its been great help
Thank you for your article on my dashboard I will put it to use.
Nice reminder I always find myself doing things the long and hard way when these systems have awesome life simplifying customization options. It’s a great teminder for me so thank you.
Thanks so much for sharing this information!!
That is really handy 🙂
I will go and setup a new customer dashboard soon.
Lyn, beautifully explained. Nice and Sweet. Very Helpful
This was very helpful and thanks for putting this on here. I just went through and created several dashboards based on your suggestions. This has been on my to do list for several months.
Thanks again!
Thanks a lot Lyn. Nice and complete article. I’m gonna set it in my dashboard.