

When your marketing strategy has a lot of branches, it’s hard to gather all of your insights into one place. But getting up to date, easy to understand analytics and insights is key to keep you and your team on track. That’s where a tool like Databox can be really useful by connecting to all of your marketing tools and displaying your data in a central location. This allows you to spend far less time creating reports and more time acting on the insights you gain from them. Or at least that’s the idea. In this post we’ll take Databox for a spin and see how it works in practice. I’ll give my thoughts on the experience at the end!
Getting Started
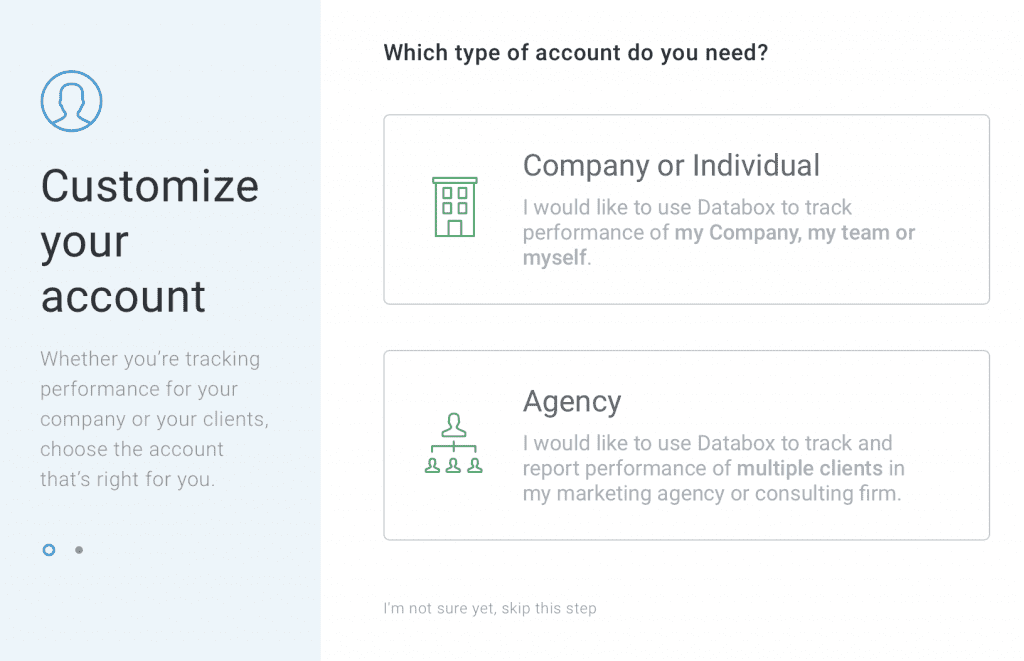
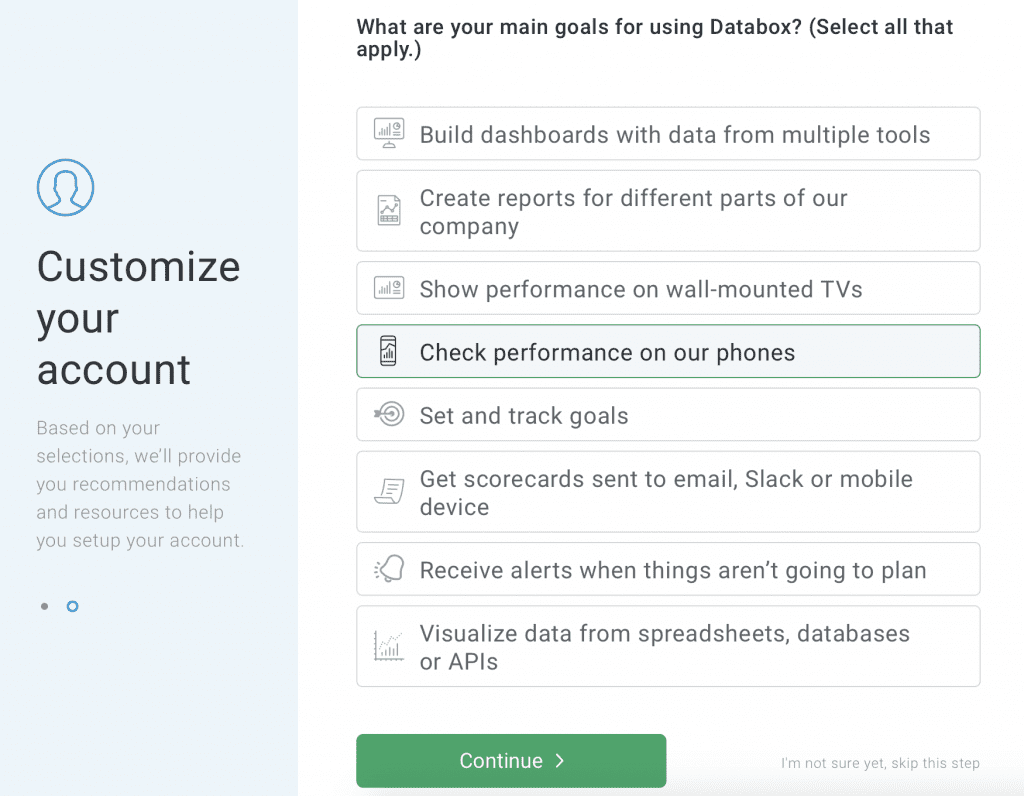
The signup process for Databoard couldn’t be easier. Even though it asks for your company email, you can use your personal email account – I signed up with Gmail. Databox has paid accounts, but you can use the free version, too, either to start or indefinitely. You’re asked a couple of questions upon signing up, but you can skip them if you want.
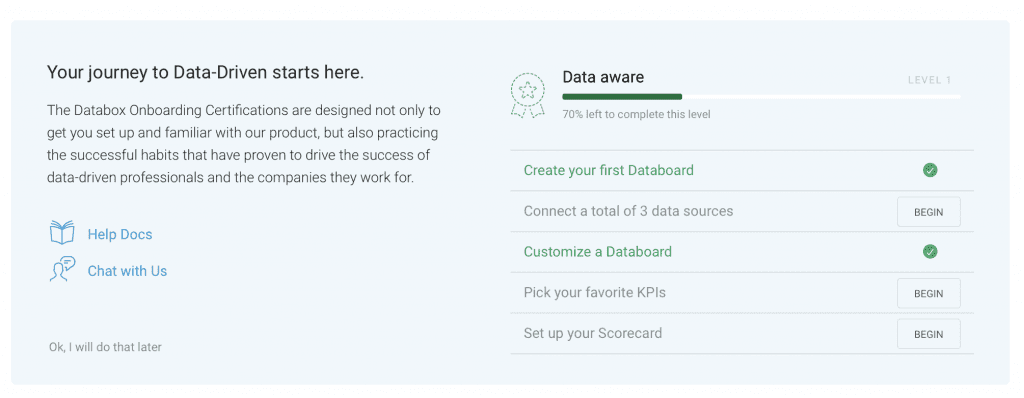
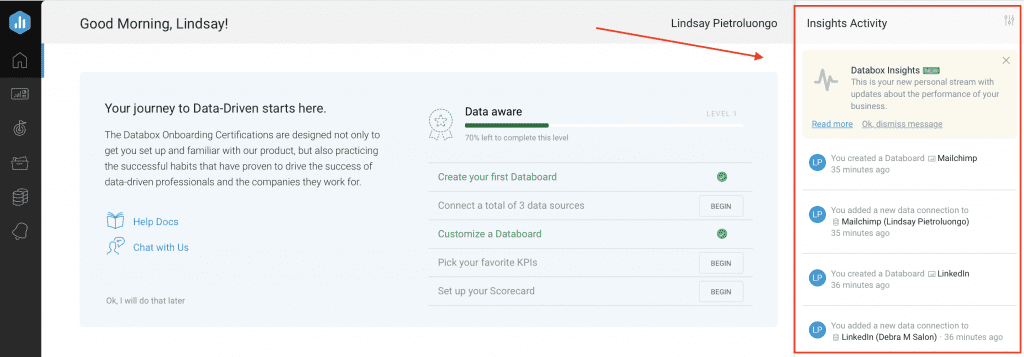
When you’re getting started, the main dashboard has goals to hit to get used to Databox features:
Databox Features
Let’s start by looking at the main dashboard. Then, we’ll talk about integrations, Databoards and reports.
Dashboard
Let’s look at the dashboard a little more. On the right, you’ll see Insights Activity, which is basically a list of everything you’ve done lately:
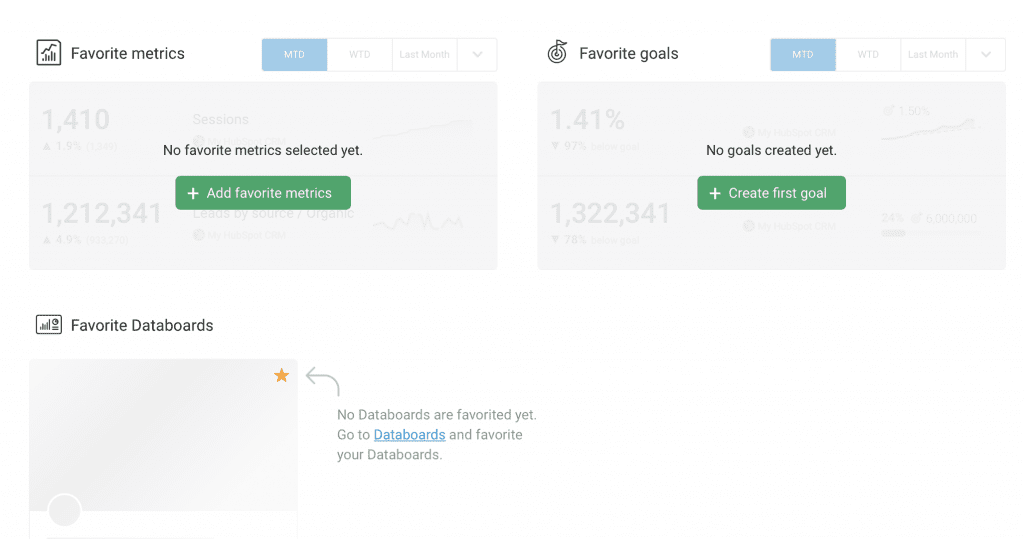
You can then add your favorite metrics, goals and Databoards:
When you add your favorite metrics, you can choose from popular metrics from all of your Databoards or you can sort by the specific Databoard.
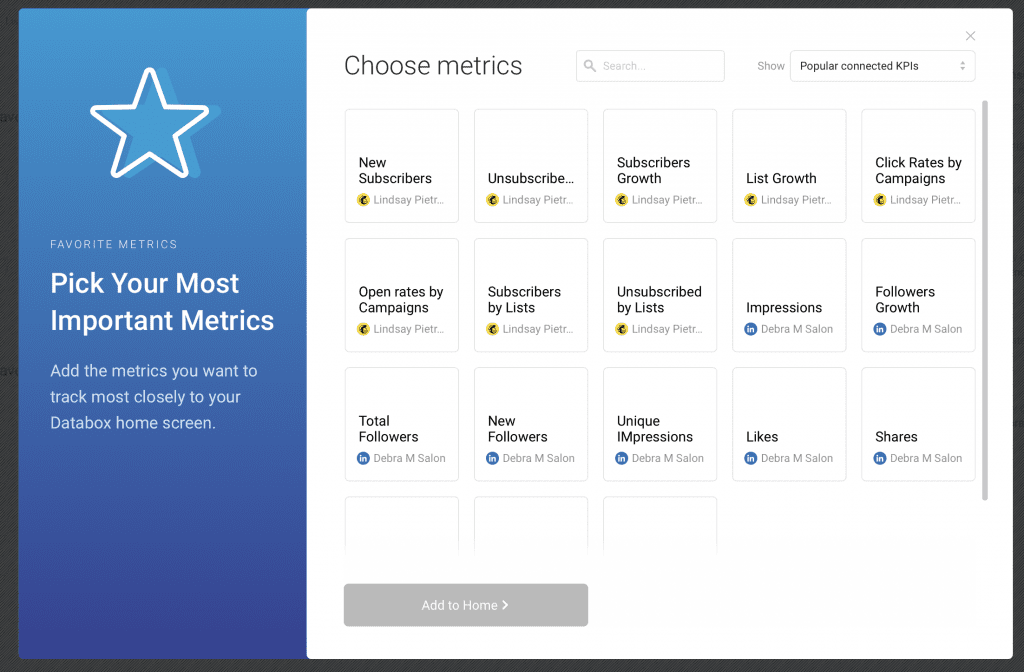
Once you’ve added metrics, you can rearrange them in your preferred order.
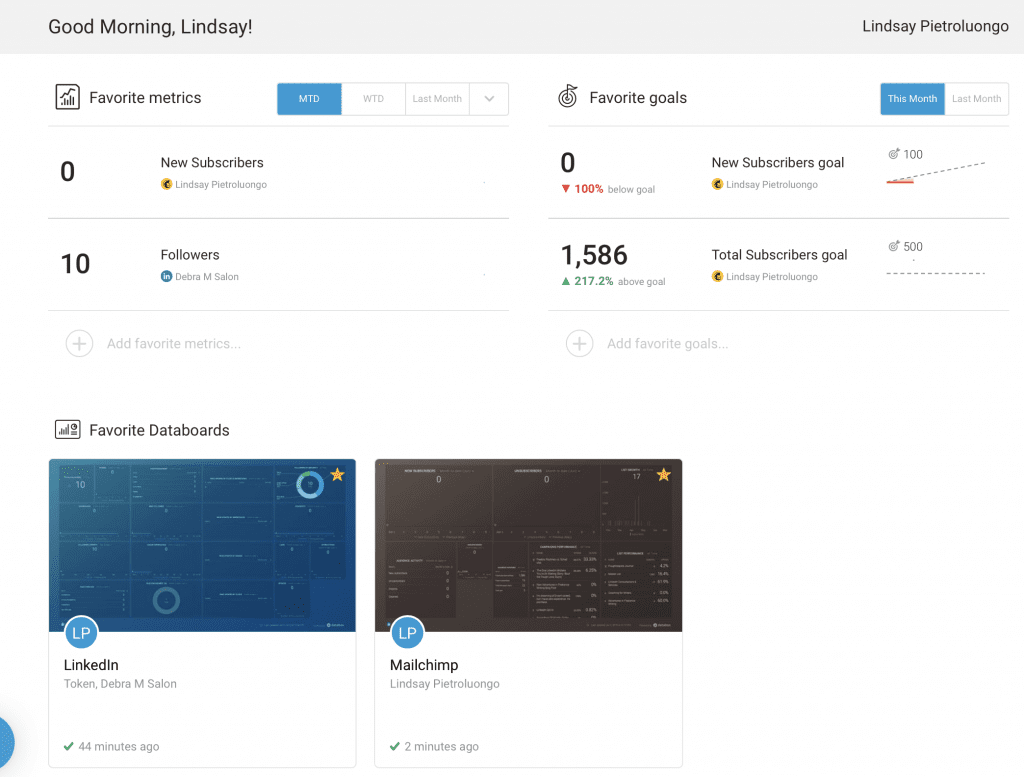
You can also add your favorite goals (and if you don’t have any yet, you’ll be able to create them), as well as your favorite Databoards. Here’s my dashboard after I’ve added some favorites:
Integrations
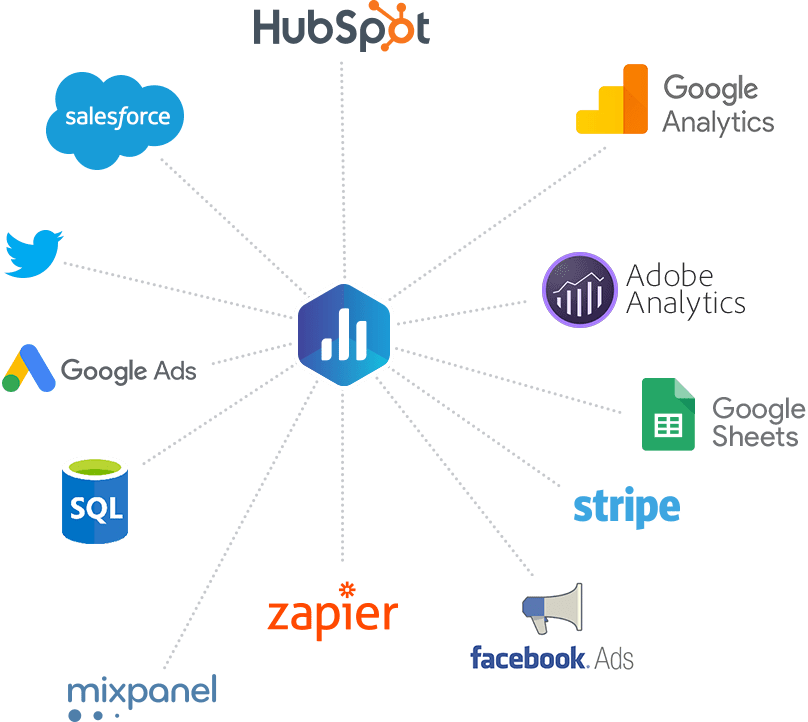
Databox integrates with more than 65 popular business tools.
If Databox doesn’t gather the metrics you need from one of the integrations, you can still pull in those metrics you’re missing with the custom Query Builder. No experience needed – anyone on the team can build custom metrics, even if they don’t know query languages or code.
Databoards
Databox revolves around the Databoards. Each Databoard represents a different one of your data sources. (Tip: When you’re getting started with Databox, use the wizard instead of creating your Databoards from scratch.)
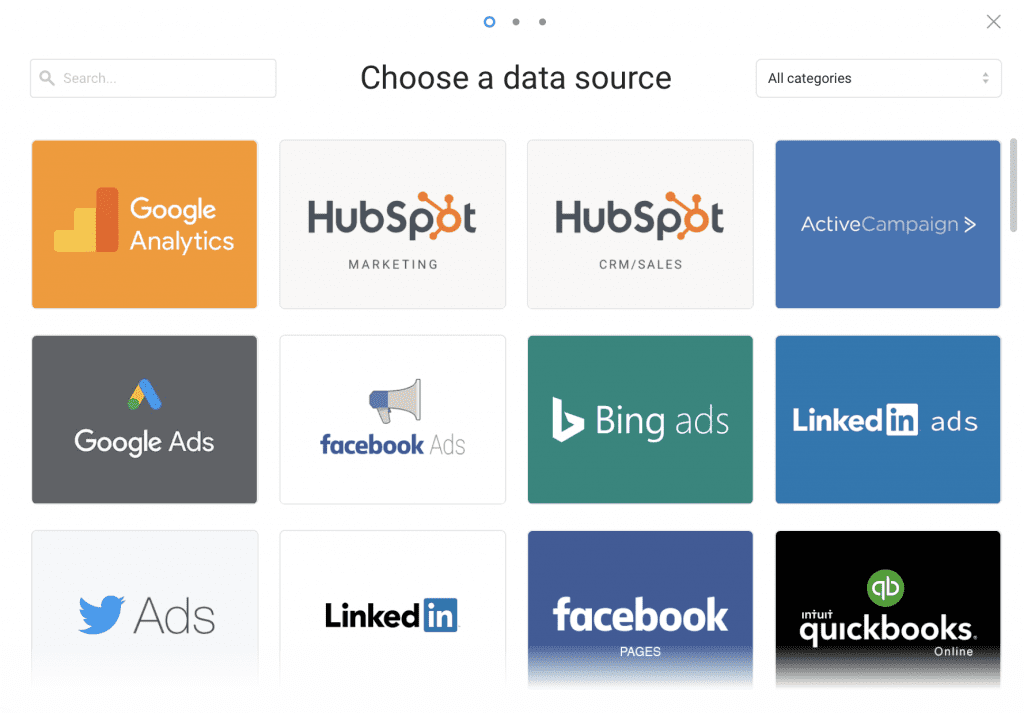
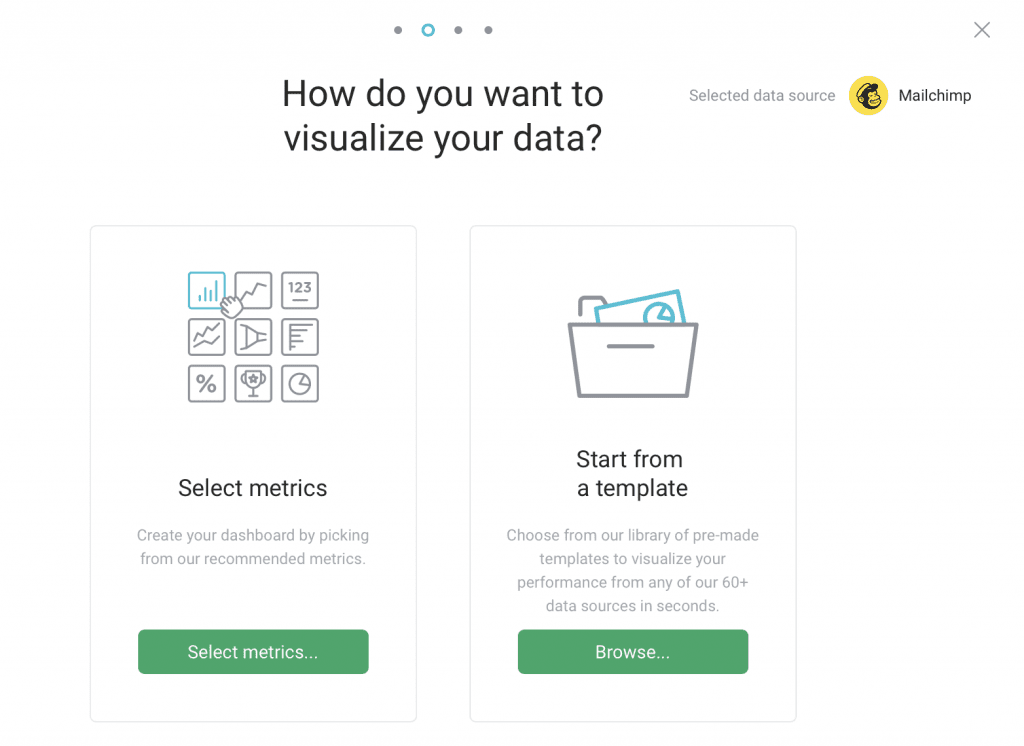
When you add a data source, you can select the metrics you want to track or you can use a template.
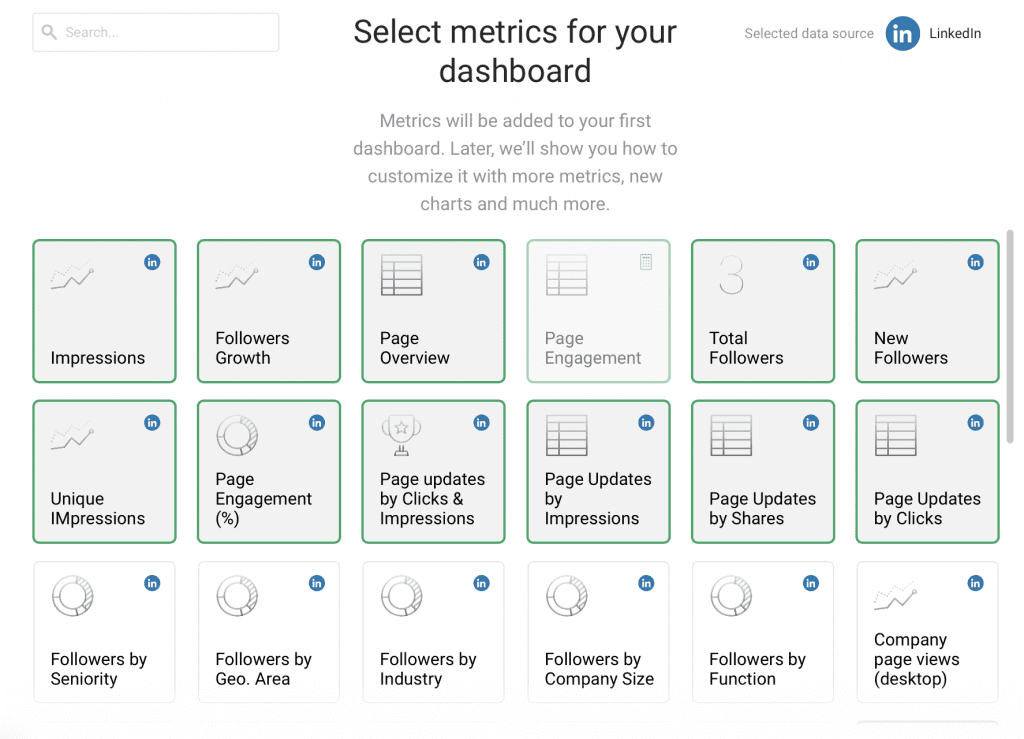
For LinkedIn (business page, not personal profile), I wanted to select my metrics:
For MailChimp, I opted for a template:
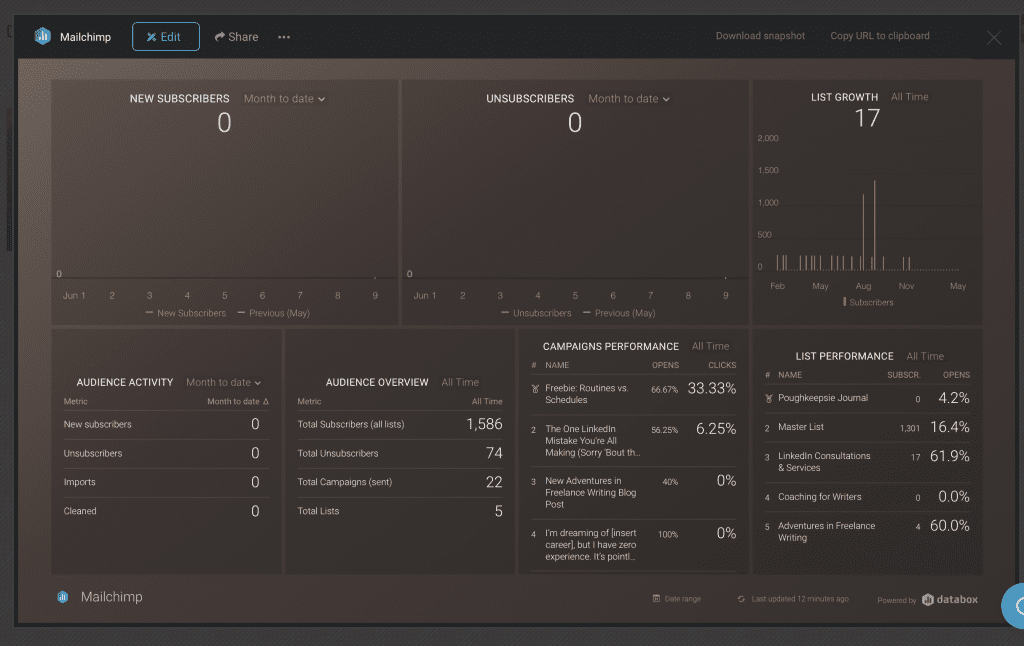
Databox has multi-device support, so you can view your Databoards on all sorts of devices: Apple Watch, desktop, mobile or TV.
Something I don’t like is that the Databoards are small compared to the size of the page. I was on my laptop, and I understand that there’s a lot of information to squeeze in, but I still think there can be a better use of space. It’s hard to see and work with this:
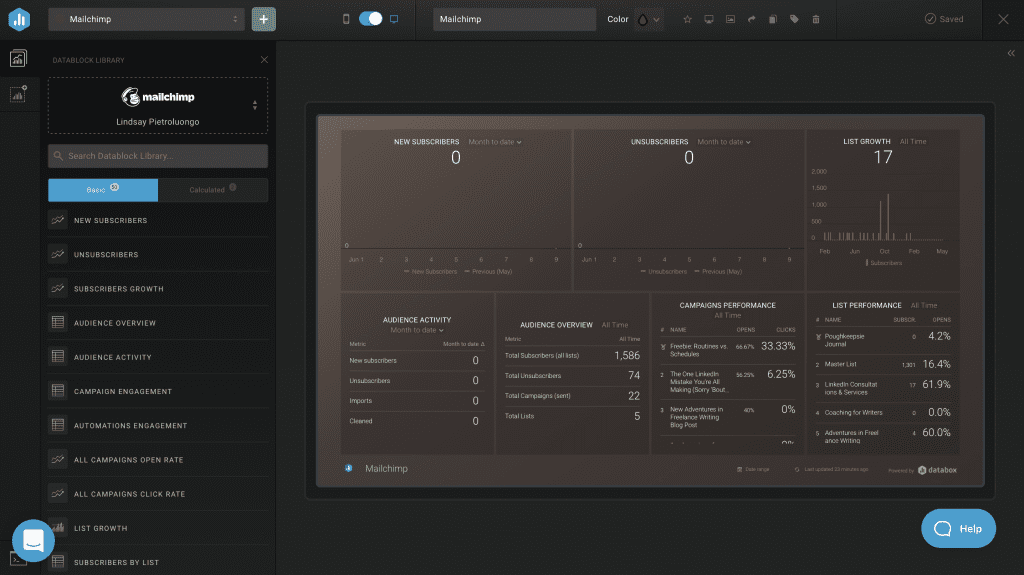
Customizing Your Databoard
Each Databoard has a Datablocks library, and each Datablock represents a different metric. You can add and arrange Datablocks to customize your Databoard however you like. You can then edit the Datablock itself to change metrics, titles, data range and how you track performance.
Once you’re finished, you can share your Databoard through email or with a URL.
Goals
Databox lets you set and track goals:
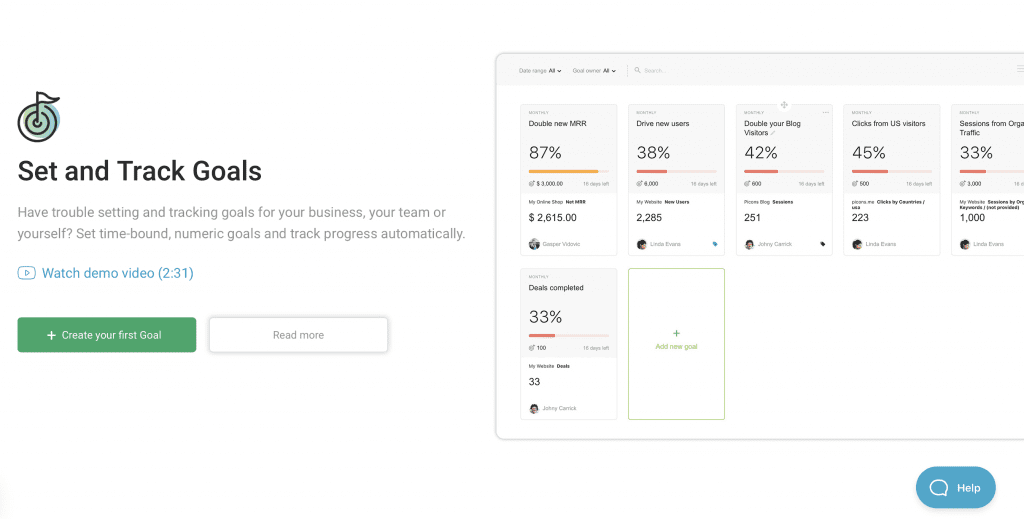
While I like this feature, figuring out how to input the right information was a little tricky. This is what you have to fill in:
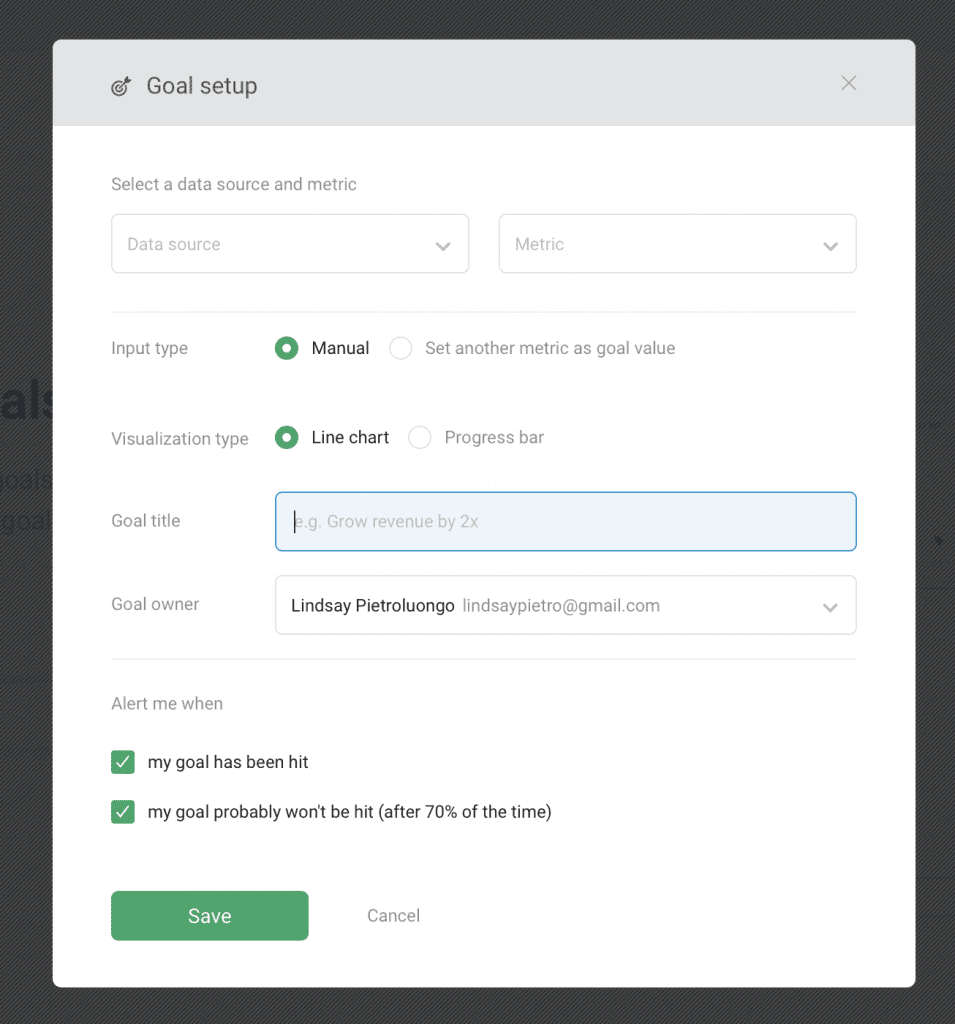
After I’d entered everything, I kept getting an error message that I was missing information in a field, but I didn’t understand what I should add. Guidance here would’ve been helpful, even a little “?” sign to give me more information about what they need. For companies that have analytics experts who will be setting all this up, this probably won’t be an issue, but for the individual who’s learning on their own and may be unfamiliar with certain terms or metrics, there’s a definite learning curve.
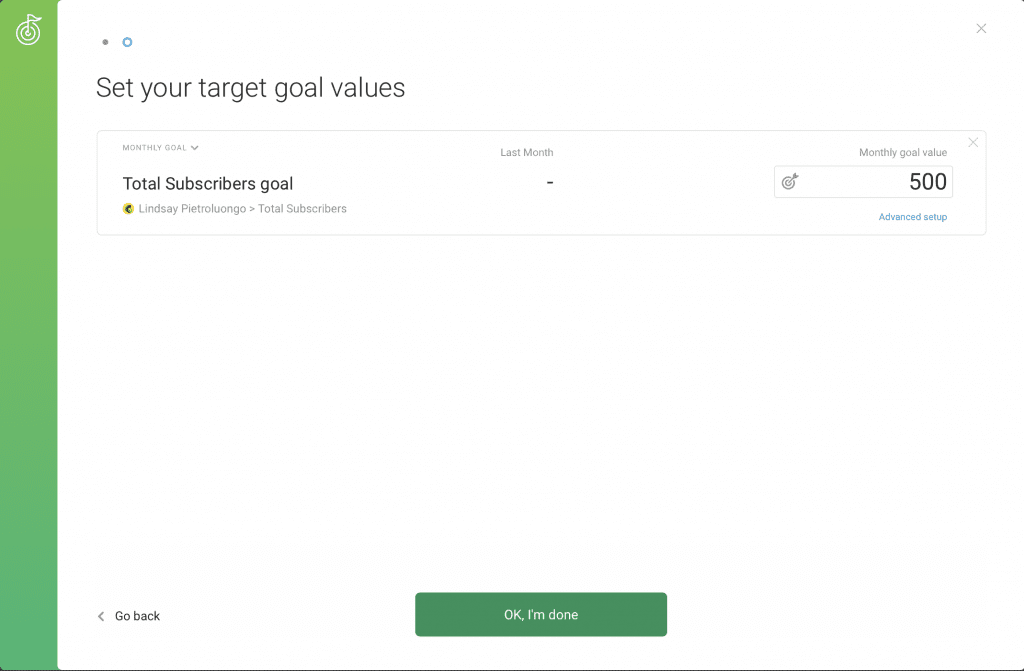
That said, there is a way to quick-add goals with very basic information. I got there by accident on my dashboard when I clicked “Add favorite goals.”
One thing I love about the goals feature is that you can set up alerts for when your goals won’t be hit. You can then go in to tweak your strategy.
Reports
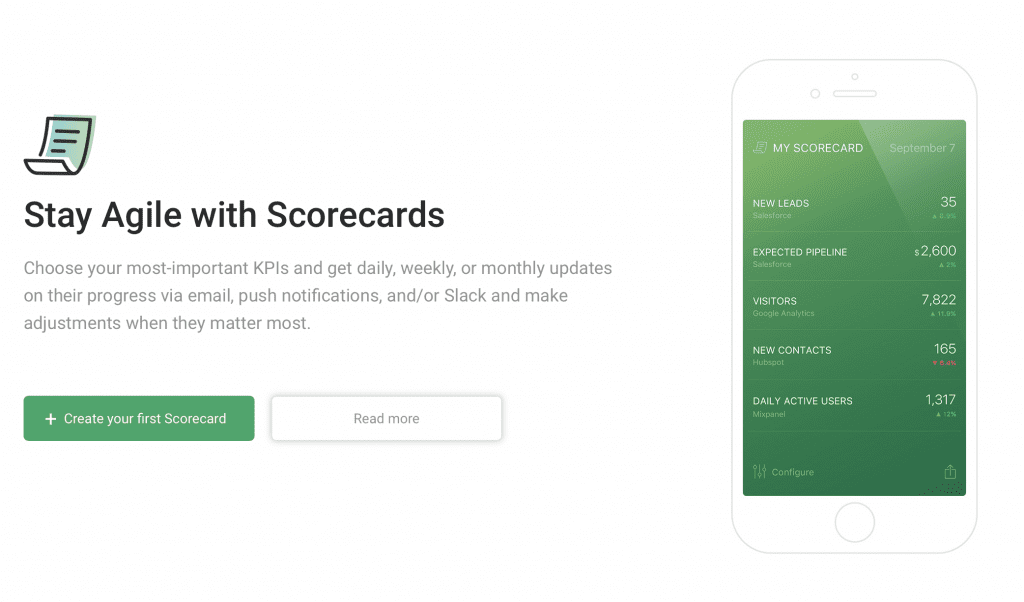
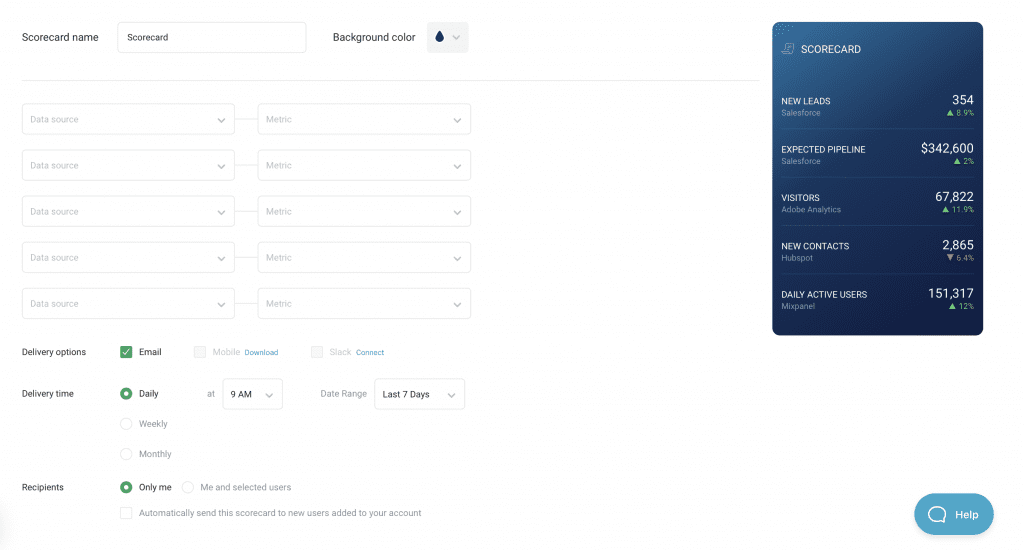
Databox has more than 200 one-click report templates to choose from. There are also tons of metric visualizations so that you can visualize your data even if you don’t have coding or design experience. I like their Scorecards feature – you can choose the KPIs that are most important to you and then get updates on progress every day, week or month. You can get alerts through email, Slack or push notifications.
Databox Pricing
The free version of Databox allows for three users and three integrations. What’s most important to note about the free version is that data refreshes daily, not hourly. If you need to see how your stats change over the course of a day, the free version won’t be right for you.
With the basic plan, data refreshes every hour. You can also use your own branding, which is great if you have to share Databoards with clients or partners.
Here are the four Databox plans and what they offer:
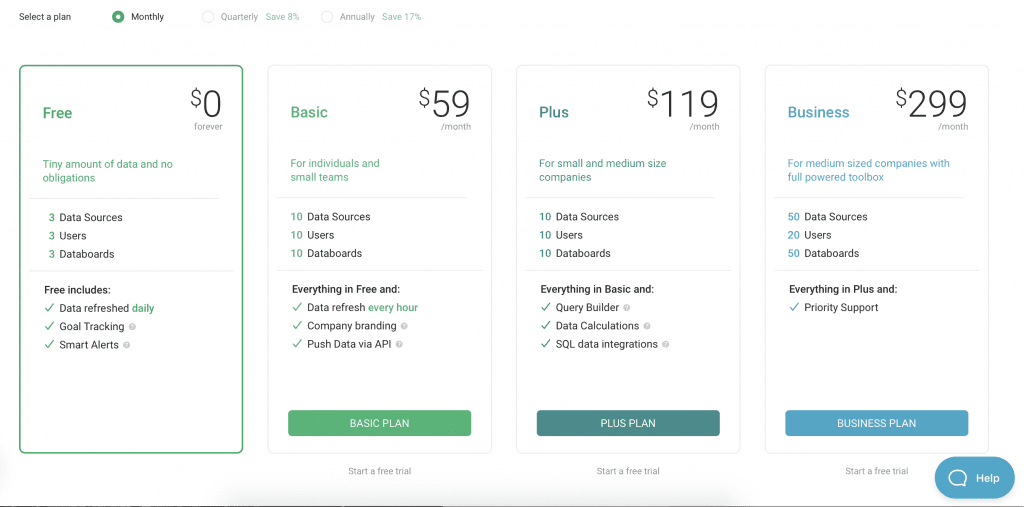
Those prices are for monthly billing. If you pay quarterly, you save 8 percent, and if you pay annually, you save 17 percent.
I think the quarterly option for the Basic plan is the best option unless you have advanced needs. The cost is just $163 every three months, you can connect 10 data sources and 10 Databoards (and invite 10 users) and the hourly data refresh is much nicer than daily refreshes.
Final Thoughts
Overall, I like Databox quite a bit. Setup is easy, you can do a lot with the free account even if you just want to play around with it before paying for an upgraded plan and there are a ton of integrations to test out. The more you know about analytics, the less of a learning curve there’ll be, but you don’t need any coding or technical experience to get your Databoards up and running, so you have a head start.
There are workarounds for the few details I didn’t like. The Databoards are much easier to read if I use my larger monitor. As for the features I don’t understand how to use (like the advanced goal setting), there’s a help chat pop-up on every page, so I can search for answers or speak to an agent.
Overall, Databox is for anyone who wants to keep an eye on their stats, from solopreneurs to larger businesses, and even personal users who want to see how their Instagram or Twitter is doing.
Remember, like all analytics tools, collecting data is just the first step toward making changes that are right for your business. Understanding KPIs will help you get a broader view of what analytics can do for you. Check out What is a KPI? A Marketer’s Guide to get started.


I’ve heard about Databox before, but I understood better when I read your blog post. I’ve added it to my notes and I’ll try as soon as possible.
Thanks.
Excellent, glad to hear, Henry!
Very nice blog, very well explained about Databox, very nice service.
I absolutely love Databox! I joined their agency partner program almost 2 years ago and now we’re a Premier Partner.
The ability to customize the databoards for clients to show progress towards goals and to simplify the language (“Where Are Visitors Coming From?” instead of the default Google Analytics “Sources”) have been huge for showing the value of our services and our expertise.
Their Predictable Performance methodology is also extremely helpful for creating a rhythm of constant improvement. You start to feel responsive instead of reactive – which clients appreciate.
If anyone wants/needs help setting up your Databox account (even the free one), let me know and I’d be happy help!
Thanks so much for your comment, Kenny, and I’m glad you love Databox so much!