
: What It Is & How to Optimize Your Website for It")
Every web page is made up of dozens or hundreds of elements. Among them you’ll find text, images, buttons, widgets, and much more. Each element varies in size, and the largest ones call tell you a lot about how well optimized your website is using a metric called Largest Contentful Paint (LCP).
In this article, we’ll explain the concept of LCP. We’ll also show you how to measure this data point and interpret the results. Finally, we’ll discuss how to optimize your LCP score. Let’s get to work!
Subscribe To Our Youtube Channel
What Is Largest Contentful Paint (LCP)?
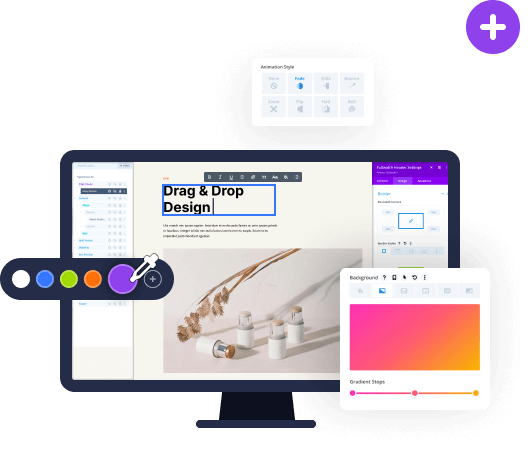
On most web pages, there’s one element that stands out from the rest due to its size and prominence. Consider this landing page, for example, where the hero section dominates the viewport:

That hero section represents the Largest Contentful Paint (LCP) for this particular page. That is to say, LCP is the time it takes for a website to render the element containing the largest amount of content.
If you wanted to find out the LCP for this page, you’d need to measure how long the hero section takes to load. In theory, if you have a low LCP score, it means your website is well optimized and loads quickly for users.
It’s important to understand that an LCP score can (and hopefully will) be different from your site’s overall loading time. You may have a page that takes three seconds to load in full, but its LCP might be only 2 seconds. That’s because most modern websites also load scripts on top of text and media files.
Usually, LCP goes hand in hand with First Contentful Paint (FCP). This is a metric that tells you how long it takes for the first element with any content to render when someone accesses your website. When combined, those metrics (or Google’s Core Web Vitals) give you a much better insight into your website’s performance than overall loading time does.
Keep in mind that when measuring your site’s LCP, Google doesn’t look at everything. It will ignore elements such as Scalable Vector Graphics (SVG) files and videos, but those may be included in future updates to Google’s Core Web Vitals.
How to Measure LCP
Usually, it’s easy enough to determine what the largest contentful element on your site. All you have to do is wait for the page to load fully and take a look around. In most cases, there’s one section or element that stands out above the rest. It might be the hero section, as we mention above or the actual post content in a blog.
It will generally be an image or text block (such as the hero section above or blog content in general). LCP also varies by user, in that it’s based on their viewport (or what content is above-the-fold).
The real trick for LCP lies in measuring how long that specific element takes to load. (Not the page itself.) Fortunately, if you’ve ever used a tool or service that enables you to measure loading times, chances are that it also includes detailed metrics such as FCP and LCP scores.
Consider PageSpeed Insights, for example. You can enter any URL and the service will conduct a full performance test for that page. In the results, you’ll see an overall performance score. There will also be a breakdown of other metrics under the Field data section—including LCP:
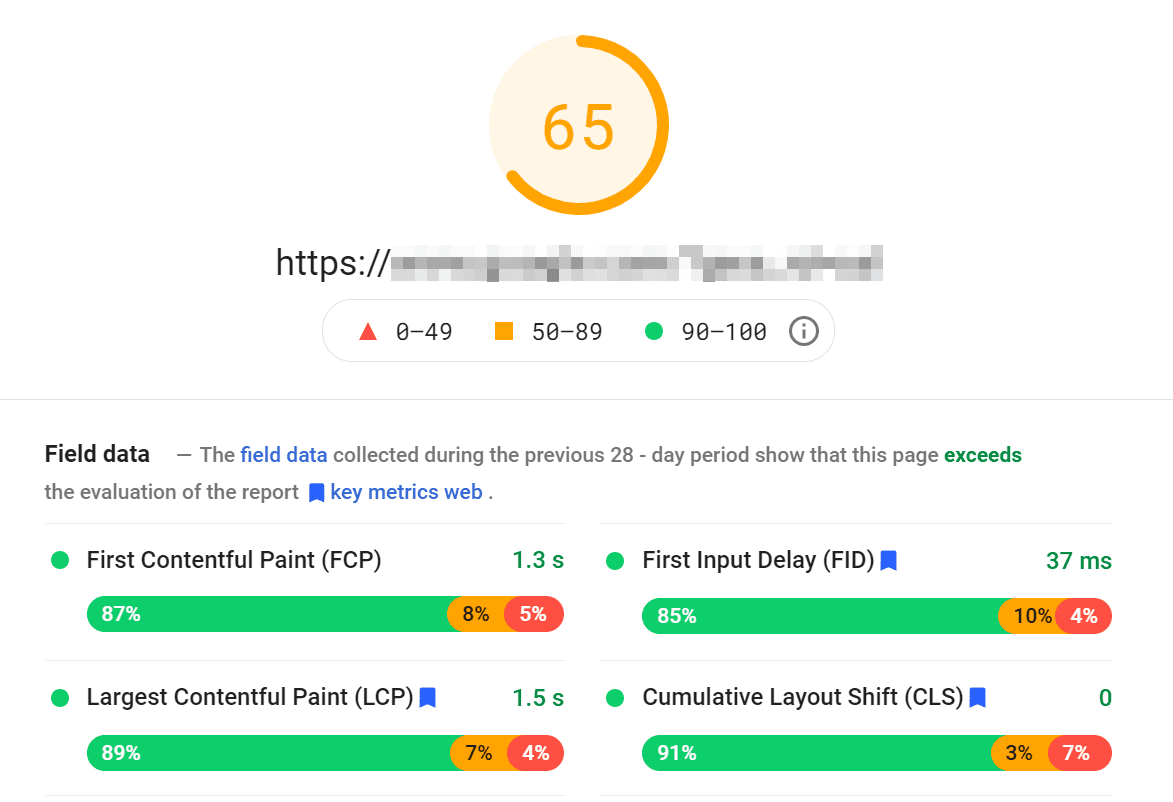
PageSpeed Insights collects real-life performance data from multiple users, and uses it to provide you with aggregate scores over time. That approach is much more precise than using a single test to determine your website’s performance.
Moreover, you get a percentage breakdown for each score. In the above example, we can see that 89% of page loads happen in under 1.5 seconds, which is a fantastic score. However, the remaining 11% of page loads fall outside of that range. This means that for some users the LCP takes a lot longer to resolve.
It’s important to understand that even if your website is well optimized, loading times will vary across your user base. Some visitors might have slow internet connections or be too far away from your servers. Those are just two of many reasons why loading times might be higher in some cases. This is why having an average score to reference is crucial.
If you scroll further down the PageSpeed Insights results page, you’ll encounter the Experiment data section. Here Google provides you with the precise results for the test it just ran on your page:
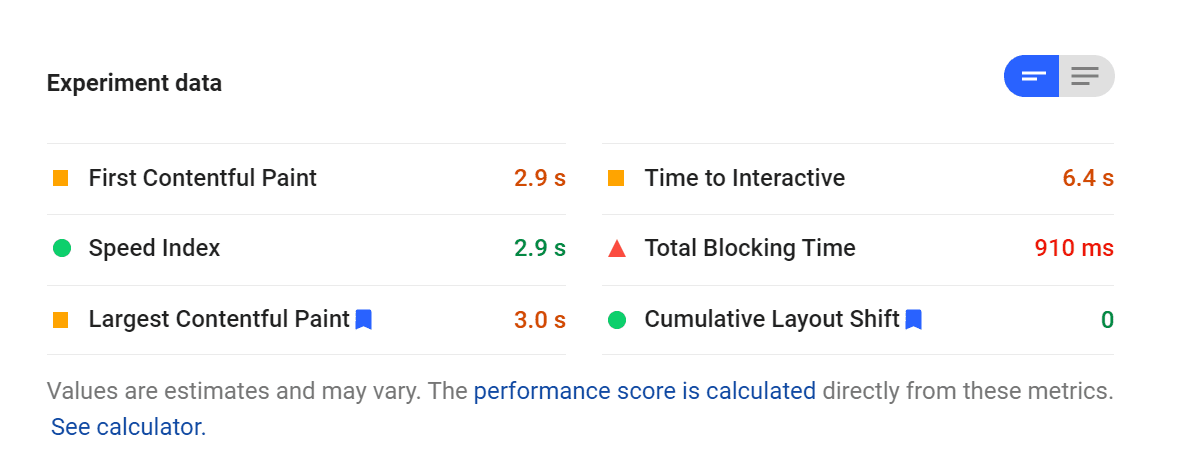
PageSpeed Insights uses this experiment data to provide you with the overall score that you see at the beginning of the results. Experiment data doesn’t provide as full a picture as the aggregate field information. However, it still gives you a pretty good idea of your website’s performance.
Ideally, your LCP score should be below 2.5 seconds (in contrast to FCP being ideal at 1.8 seconds). The lower this time is, the better. For the best scores and experience, your overall loading times should stay under 3 seconds. After that point, you’ll usually start seeing a marked increase in bounce rates.
In our experience, PageSpeed Insights is the best tool you can use to measure LCP and overall loading times. However, you can also access the same information if you set up Search Console for your website, which we definitely recommend for Search Engine Optimization (SEO) purposes.
If you want to look outside of Google, you can also measure LCP times manually using your browser’s dev tools. Most dev tool kits enable you to measure page loading times, offering details on how long it takes to load each element and process each request. However, this manual approach involves a lot more work than using a third-party service.
You can also use services such as GT Metrix and Pingdom’s Speed Test to see additional insight into your LCP and other page loading metrics.
How to Optimize Your LCP Score
If you can identify the largest element on your page, you should be able to optimize it. For example, if that element is an image, you can always use a compression tool to reduce its file size and improve your LCP score.
However, that approach only works if your website isn’t well optimized. If you’ve already taken steps to improve your site’s performance, then you’ll need to consider different approaches to optimize its LCP scores.
In our experience, here are the most effective optimizations you can make to improve your website’s LCP scores:
- Resize and compress images. In most cases, images will determine your LCP scores. As a rule of thumb, you should resize and optimize every image that you upload to your website, which is easy to do automatically using an image optimization plugin. WordPress 5.8 automatically serves WebP images to users now, which can help many sites’ LCP times.
- Choose a better hosting service. If you’ve worked hard to optimize your website and it’s still taking too long to load, it’s probably due to your web host. You might be using a plan that can’t keep up with your site’s popularity, or your web host might not offer the performance you need. Regardless of the work you put into your site, a solid hosting plan can make or break it.
- Use a Content Delivery Network (CDN). CDNs can cache copies of your website on server clusters around the world and serve them to visitors. Some CDNs also offer image-specific services, which can help reduce LCP scores immensely.
- Eliminate render-blocking resources. A resource is “render-blocking” if it stops elements on your website from loading until after it executes. In general, these are critical structures for your site, such as HTML, CSS, and JavaScript. As a rule of thumb, you want to eliminate or defer elements that do this or force them to run after everything else is done loading. A number of plugins such as WP Rocket (or the Divi theme itself) can do this for you with a toggle.
By and large, all of those optimization methods are standard recommendations if you’re working on improving your website’s performance in any way. If you take the time to optimize your website, your LCP scores should go down accordingly, and your users will be all the happier for it.
If you’re a Divi user, many of these things are done for you automatically. For instance, the Divi theme’s Critical CSS feature takes out render-blocking resources automatically and defers their loading. That’s one of the many reasons Divi is so fast and gets great LCP scores out of the box!
Frequently Asked Questions About Largest Contentful Paint (LCP)
Understanding a concept like LCP is less intuitive than making sense of a single overall loading time for your page. With that in mind, here are some of the most frequently asked questions that we see concerning LCP scores.
How Does LCP Fit into My Website’s Overall Performance?
When measuring your website’s performance, a single overall loading time won’t give you an accurate idea of how well optimized your pages are. Focusing on specific metrics such as LCP gives you a much better insight into how your servers are responding. It also tells you how long it takes for users to see your website in full. Targeting LCP or other metrics specifically will only improve your site’s overall performance, as they’re part of a larger whole.
Is LCP the Same as Page Loading Time?
It’s common for website owners to test their pages and see how long each one takes to load. Some performance measuring tools give you a single number and nothing else. However, individual metrics such as LCP help you get a better understanding of what actually happens when a user visits your website.
LCP will most likely happen before the entire page has loaded. And some elements may fill in after it (larger file sizes or images). Ideally, your LCP time will be faster than your overall page loading time.
What Are Other Core Web Vitals Beyond LCP?
The Core Web Vitals are metrics that Google takes into consideration when trying to determine if a website offers a strong User Experience (UX). LCP is just one of those vitals. Others include First Input Delay (FID) and Cumulative Layout Shift (CLS). You can also check for First Contentful Paint (FCP) which is more tied to the user’s perception of how quickly your page loads.
Conclusion
When assessing your website’s performance, it’s best not to focus on a single number, such as how long it takes your home page to load. While that is important, the individual metrics such as LCP can help you identify specific elements and areas that may need improvement.
Each page’s Largest Contentful Paint gives you an idea of how long visitors have to wait until the page loads enough for them to make sense of it. With FCP, it’s how long it takes to see the page. Even then, they might have to wait longer until it becomes interactive, which might come after the LCP. This metric is a single piece of the puzzle. However, by optimizing this score you can offer a much better UX on your website.
Do you have any questions about how to measure or improve LCP scores for your website? Let’s talk about them in the comments section below!
Featured Image via NeMaria / shutterstock.com


Thank you for the Article, I am new in SEO, One thing i’ve noticed, While creating a simple navigation menu, My site is still good with page index. And when i am trying to create a mega menu, it is hazzard with low profile speed rating. DO mega menu affect the speed??
Hi Will.
Great article highlighting what LCP is and how to improve it.
Will definitely be taking some of your advice into careful consideration when we review the sites speed tests again.
Hi Mark, I’m glad you found it helpful 🙂
Yesterday’s article on FCP helped me solve a big issue with page speed back at GT Metrix yesterday and while I’m getting a A rank for this particular artist website, this blog post has provided me with an explanation on how to reduce the LCP.
Many of the metric sites don’t provide enough information on the how to fix this. Thanks Will. Really appreciate this post.
You’re welcome 🙂
Thanks for the article which has cleared a few things up for me. I can understand my figures for the Desktop performance but I’m still scratching my head about Mobile. As an example, a page for one of my articles is 410Kb in size. When I test with Lighthouse the Desktop performance scores 100 with FCP 0.3s, LCP 0.6s and Time to interactive 0.3s (fully loaded 734ms). But the Mobile performance score is 90 which seems to be pulled down by the LCP figure of 3.5s. The FCP is 1.5s and Time to interactive is 1.5s. The LCP of 3.5s seems unusually large and the same scenario is repeated on my other pages, often with the difference between Desktop and Mobile LCP being much larger.
Am I reading something into these figures that isn’t there? Can you offer any hints on tracking down what might be causing the difference?
Robin, one thing that I’ve done to help with the inconsistent mobile results like that are to check image sizes. A lot of slowdown on my own sites has come from unoptimized image sizes (resolution). The page has to load a full-size image, let’s say, and then render it for responsive viewport. If you have an image size that will always display the same regardless, it should speed up some mobile sites.
For instance, you have an image location that’s 250px wide. You can make sure that any images that go there are 250px wide when you upload them, that way the browser doesn’t have to resize them dynamically based on viewport. While “30vw” or “15%” are great for most things, when optimizing sites like this, you can find some locations that you can cut out the responsive automation and save a few milliseconds here and there.
Hope that helps a little!
Thank you for this informative article.
You’re welcome 🙂